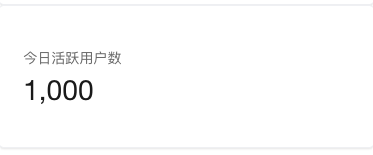
Stat Card
Applicable Scenarios#
提供报表场景下的指标数据统计并展示功能。

Usage Instructions
Data Model Use Cases
- Set the data source for the statistical card, select the existing data model, and select the data source method - statistics.
- Configure the data value range through data filtering. For details, see Data Filtering Configuration Document.
- Select the fields that need to be counted.
- Based on the selected fields, set the statistical method for that field. Currently, "numeric" fields support counting, summation, maximum, minimum, and average; other field types only support counting.
- Select whether to count null values. By default, null values are not counted.
- Supports display unit settings. Numerical magnitudes: units/tens/hundreds/thousands/ten thousands/hundred thousands/millions/ten millions/hundred millions.
- Decimal places: supports setting
0-10decimal places. - Suffix: supports customization. By default, it is generated based on magnitude:
-/tens/hundreds/thousands/ten thousands/hundred thousands/millions/ten millions/hundred millions.
Properties
External properties received by the component
Property Name | Property Identifier | Type | Description |
|---|
| Data source | dataSource | object | |
| data filter | filterData | object | |
| field selection | field | object | |
| 统计方式 | operationType | string | |
| 字段展示名称 | label | string | Example: "今日活跃用户数" |
| 是否统计空值 | isCountEmpty | boolean | Example: false |
| 是否显示单位 | isShowUnit | boolean | Example: true |
| Numeric value magnitude | unit | number | Example: 1 |
| number of decimal places | decimalDigits | number | Example: 0 |
| suffix | suffix | string |
Events
Events exposed by the component. You can listen to component events to trigger external actions
Event Name | Event Code | Event Output Parameters event.detail | Applicable Scenarios | Description |
|---|
| click | tap | Compatible with all platforms | - |
API Use Cases
When APIs are selected as the data source during configuration, users must define data within the APIs according to the parameter structure for proper rendering in the statistical card component. For details, see Chart Component Parameter Definition.
? When using APIs, data filtering, field selection, statistical methods, and statistical properties for null values must all be defined by the user within the created APIs. Other properties remain consistent with the configuration of the data model usage scenario.
Frequently Asked Questions
The reason why charts do not support displaying Chinese names for association/enumeration fields
Since the chart component retrieves statistical data by querying the server, it currently does not support displaying Chinese names for association/enumeration/option set fields. If you need precise control over chart display, you can use the Universal Chart, which allows flexible display configurations through customization.
How to flexibly control various chart styles, such as centering the title?
Since the chart component itself only provides common configurations, for elements that cannot be configured within the chart component, you can use the Universal Chart to achieve various flexible display effects.
Relationship Between Chart Component and Universal Chart Component
- The Universal Chart component is a versatile chart component capable of configuring various charts such as line charts, pie charts, area charts, maps, funnel charts, dashboards, and all other chart types. Using this component enables quick integration of all Echarts charts.
- The UI configuration of the Universal Chart component is more flexible, supporting virtually all common chart types.
- The Universal Chart component itself is data-agnostic. Data statistics can be achieved through Query, where data aggregation is performed via APIs or the MySQL connector, and then bound to the Universal Chart component.