Monitoring
This document describes how to view service-related monitoring.
Operation Steps
- Go to CloudBase Platform/Cloud Functions.
- Select the
Cloud Functionyou want to view and click to enter theDetails Page. - Click
Monitoringto switch to the monitoring tab, where you can view the current service logs.
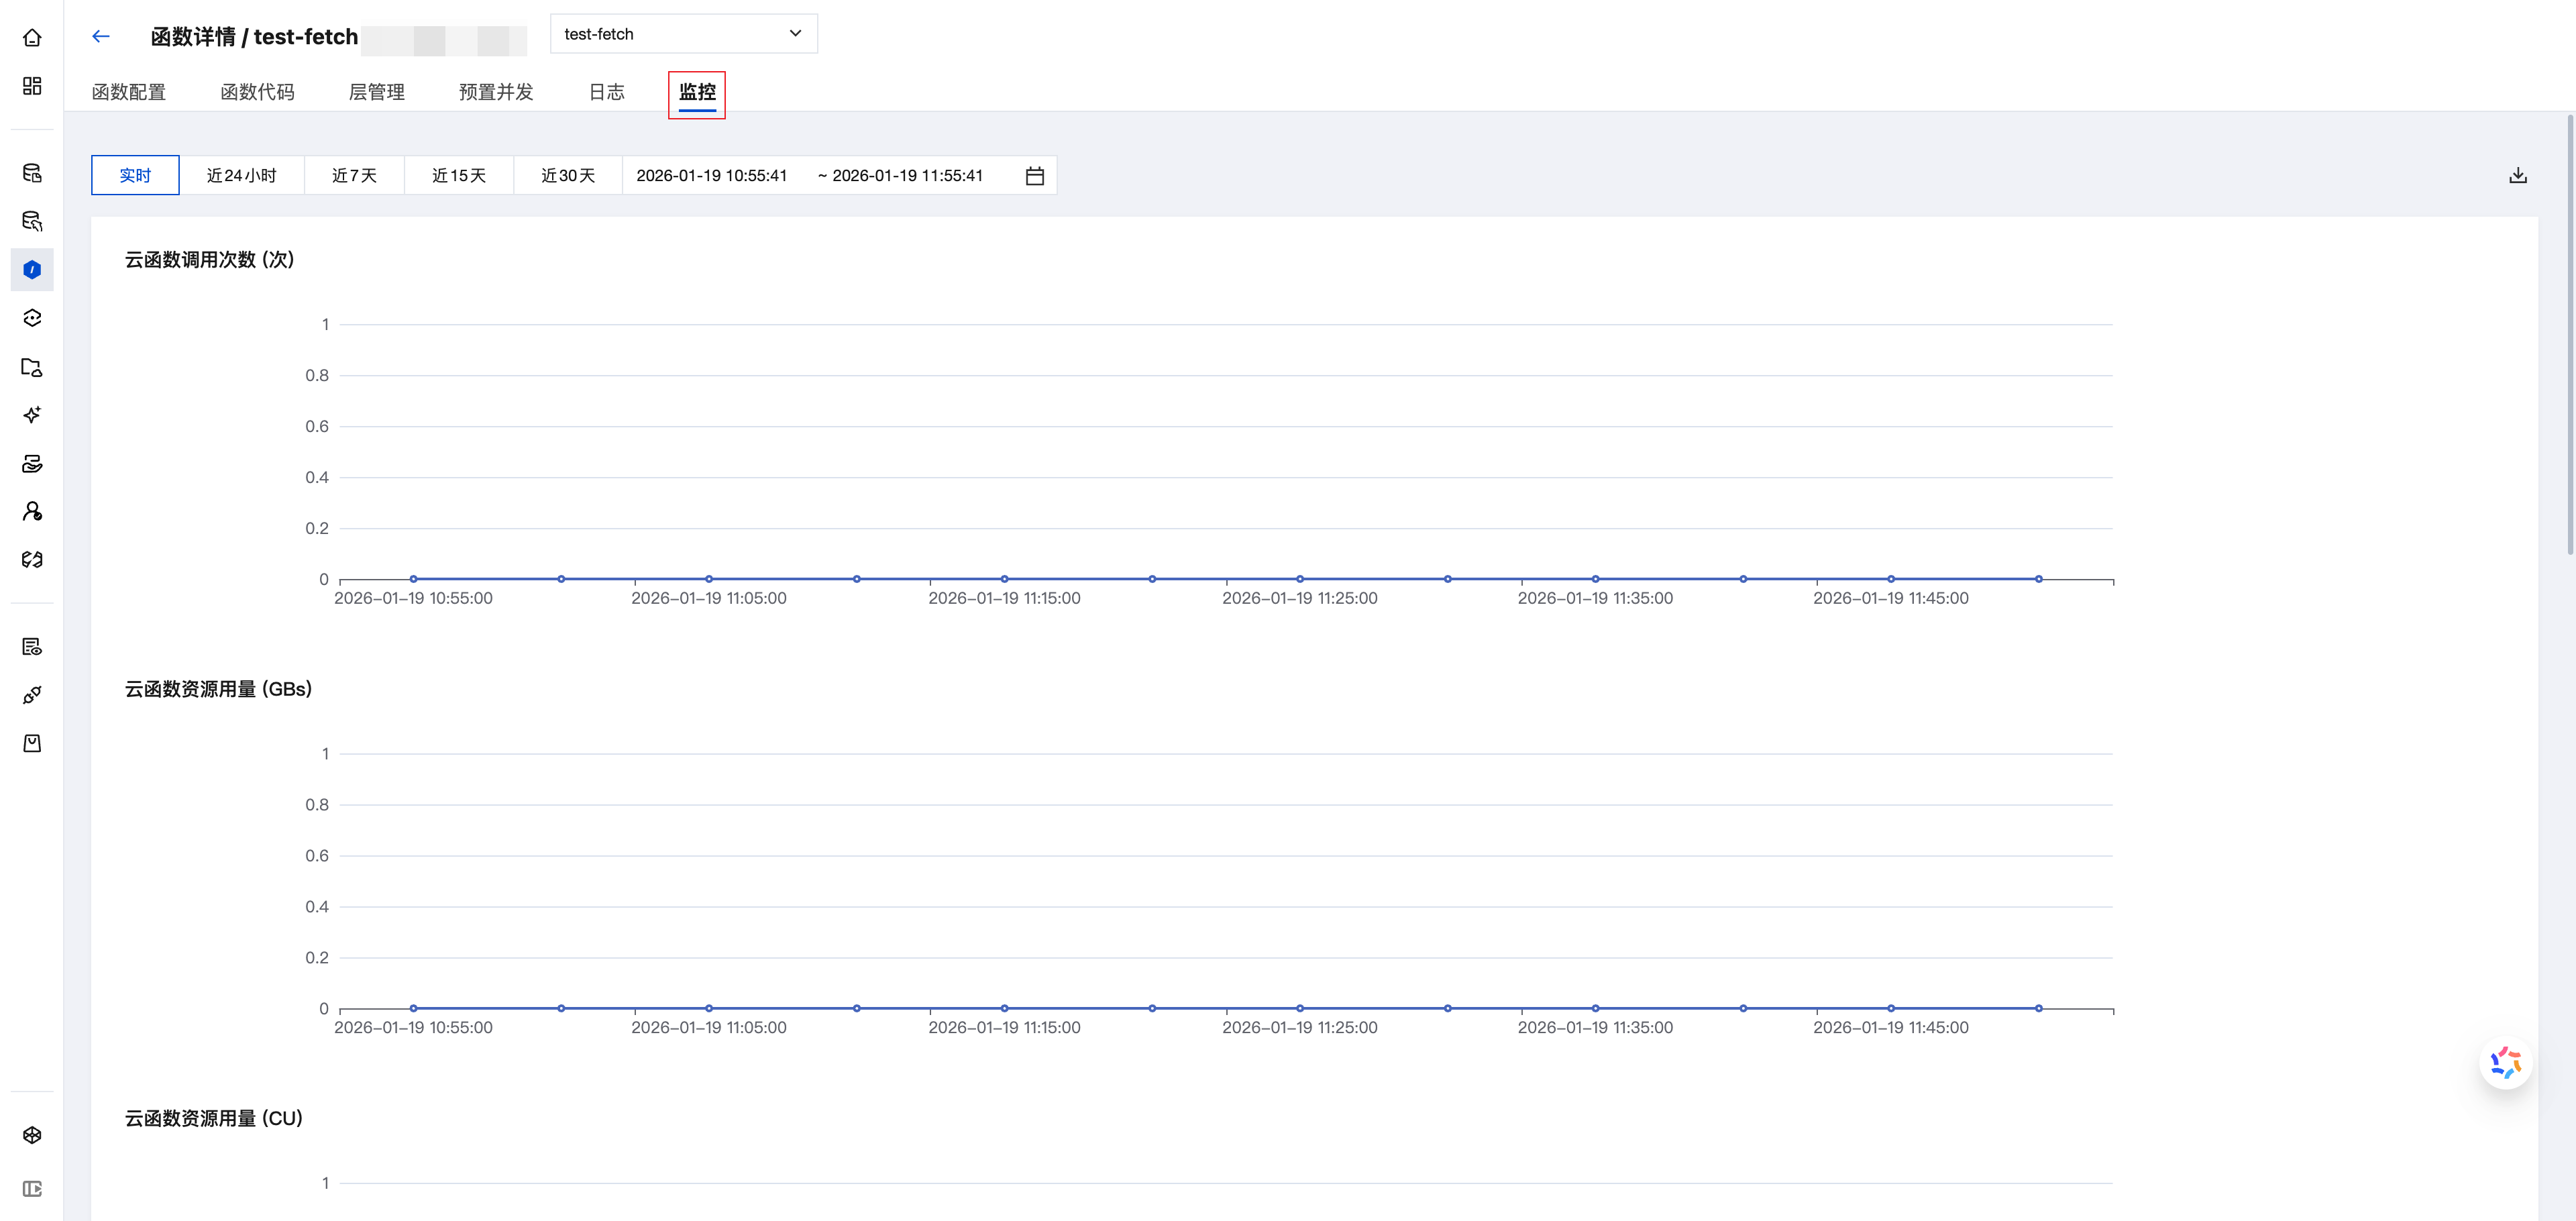
Monitoring Field Description
Tabs
- In the monitoring tab, the top time filter applies to all monitoring data on the page. For example: if you select "7 days" at the top, the statistics cards and curves will display data from the past 7 days.
- The "granularity" in the monitoring curve chart refers to the unit time corresponding to each monitoring data point, which varies with the selected time range. Longer time spans result in coarser granularity. All values on the curve chart should be interpreted in conjunction with the granularity.
Metrics
- Cloud Function Invocations (times): The number of requests at the function/region level, aggregated by granularity (1 minute, 5 minutes).
- Cloud Function Resource Usage (GBs): A cloud function instance with 1 GiB configured memory running for 1 second.
- Cloud Function Resource Usage (CU): A cloud function instance with 1 GiB configured memory running for 1 second. 1 GBs = 1 CU.
- Cloud Function Traffic (KB): Outbound traffic generated when accessing external network resources within the function, aggregated by granularity (1 minute, 5 minutes).
- Cloud Function Error Count (times): The number of error requests generated after function execution, currently including the sum of customer errors and platform errors, aggregated by granularity (1 minute, 5 minutes).
- Cloud Function Runtime (ms): The runtime at the function/region level, referring to the time from the start to the end of the user's function code execution, averaged by granularity (1 minute, 5 minutes).