Application Debugging Guide
Definition and Purpose of Debugging
Definition of Debugging
Debugging refers to the process in software development of using a series of tools and techniques to monitor a program's operational status, analyze its execution flow and data structures, in order to discover and solve problems.
Purpose of Debugging
- Better understand the program's operational mechanisms and internal implementations
- Better optimize the program's performance and functionality
- Improve program quality and stability
- Reduce program errors and malfunctions
WeDa Web Application Debugging
Installing WeDa Developer Tools
To facilitate developers in debugging real-time preview pages, you can install the Chrome extension: WeDa Developer Tools for debugging purposes.
For installation methods, please refer to: Weda DevTools Installation Guide
After installing the Chrome extension, click the ▶️ button in the application editor to open the preview page, click Share, and open it in a new window.
 On the newly opened page, open Chrome Developer Tools.
- In the Chrome menu, select More tools > Developer tools
- Right-click on the page element and select "Inspect"
- Use the shortcut keys Ctrl+Shift+I (Windows) or Cmd+Opt+I (Mac)
Then locate the WeDa Developer Tools panel to debug
Debugging Runtime State Values Using the Component Panel
The Component Panel is a panel within the WeDa Developer Tools that helps developers view information such as the component tree, properties, styles, and event configurations in the application to debug runtime state values. Specifically, the methods for debugging runtime state values using the Component Panel include the following steps:
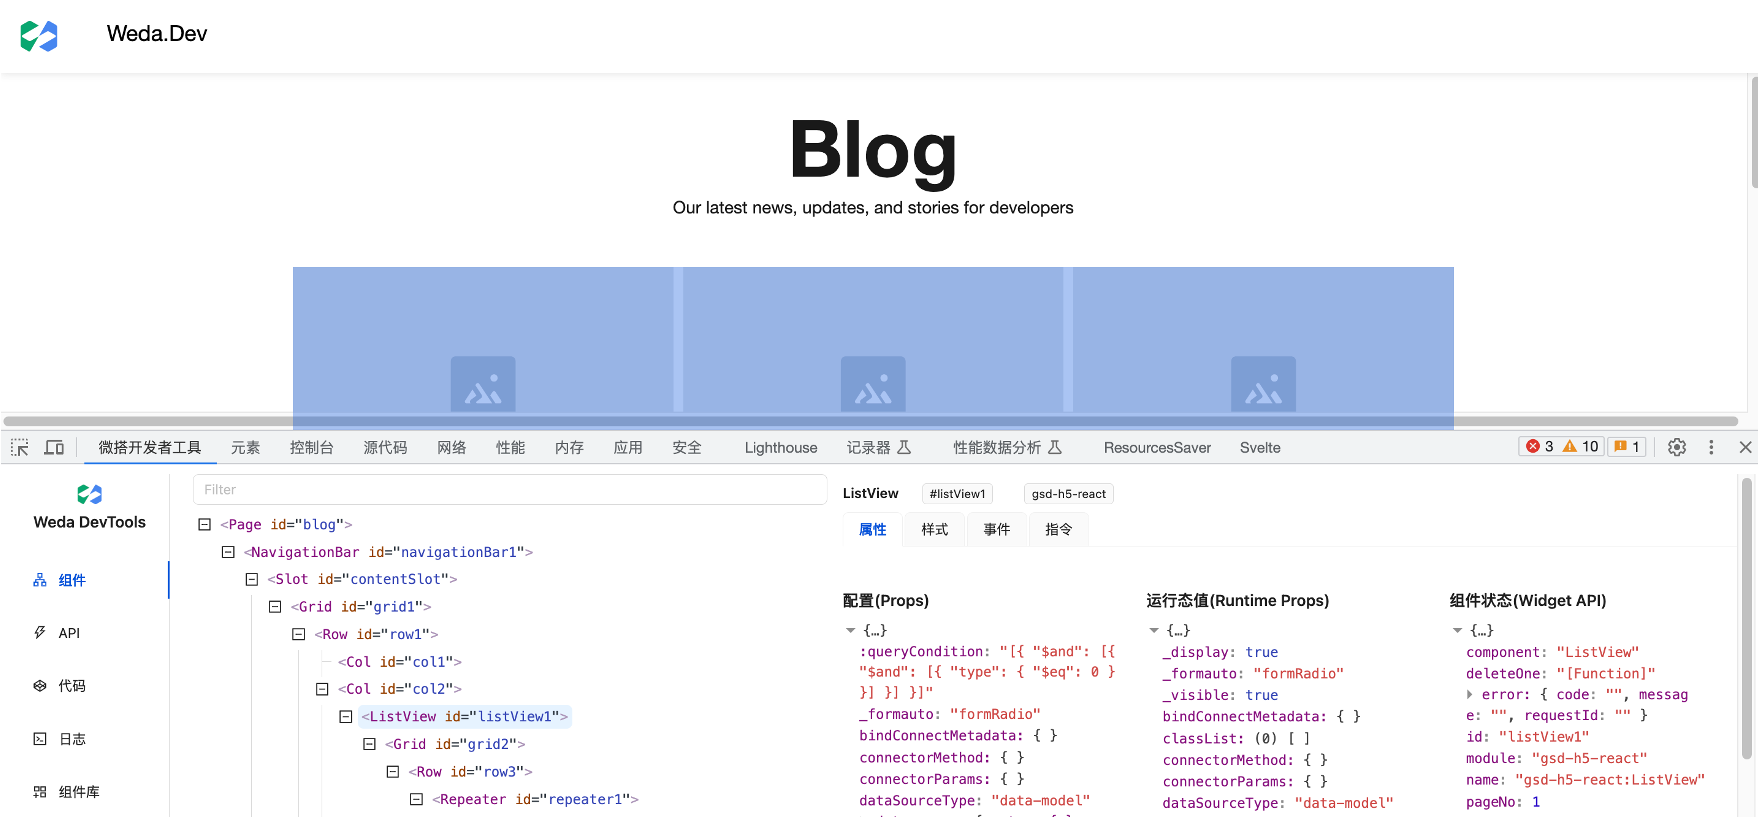
- Open the component panel: In Weda DevTools, click the Components tab to open the component panel.
- View and search the component tree: In the component panel, you can view the application's component tree to understand the relationships and hierarchical structure between components.
- View the properties, styles, and event configurations of a single component: In the component panel, you can select a single component and view its properties, styles, event configurations, and other information to understand the component's specific attributes and behavior.
- View the runtime state values of components: In the component panel, you can select a runtime component and view its state, including information such as props and state, to understand the component's runtime status. For example, by viewing the records property of the ListView, you can see the backend list data obtained at runtime.
Using the Component Panel to debug runtime state values helps developers better understand information such as the component tree, properties, styles, and event configurations in the application, facilitating the debugging of runtime state values.
When encountering a situation where a certain part of a page fails to render as expected, it is recommended to use the Component Panel to determine whether the issue stems from configuration, state, or rendering problems, thereby improving problem localization efficiency.
Debugging Network Interfaces Using the API Panel
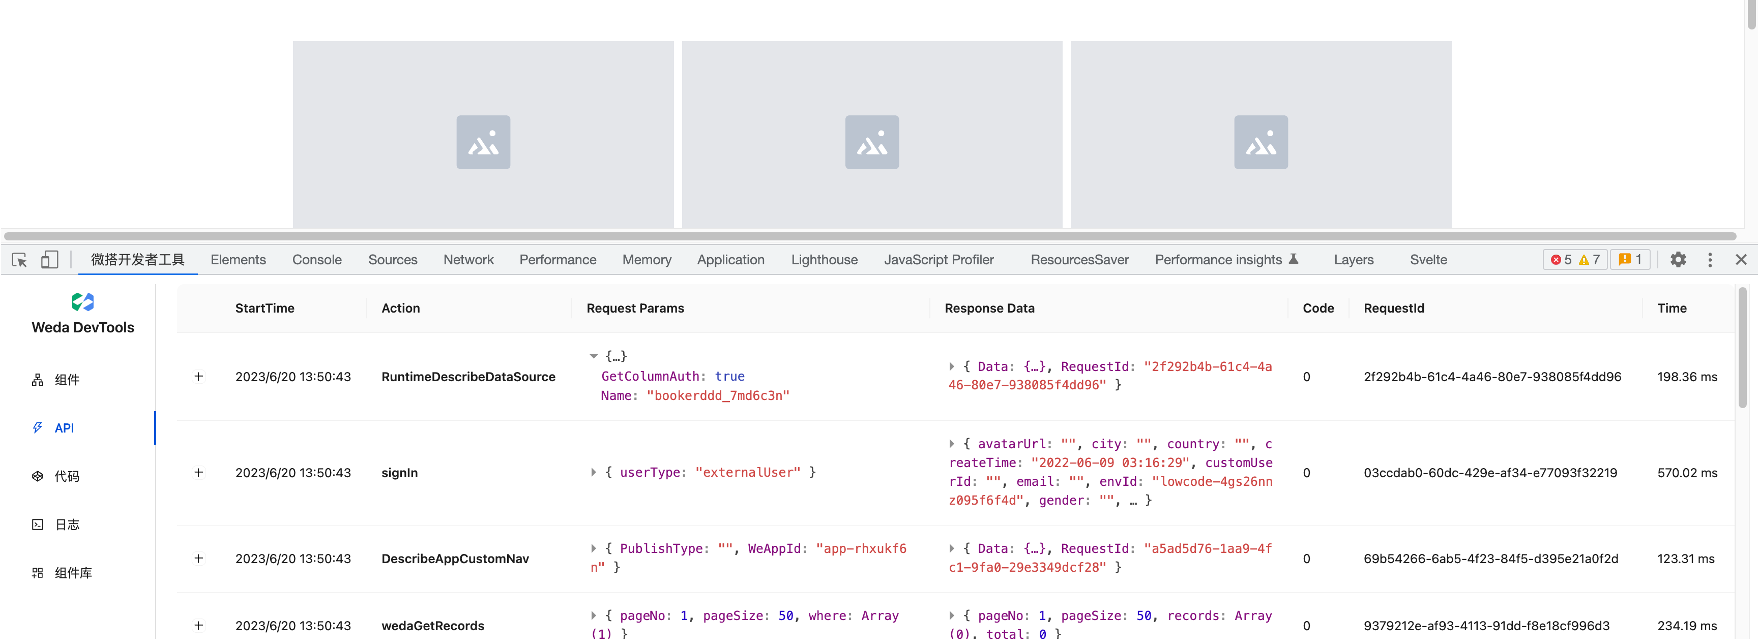
The API Panel helps developers debug network interfaces, making it more convenient to view information such as input parameters, output parameters, exception details, error codes, and requestId for WeDa-related runtime interfaces.
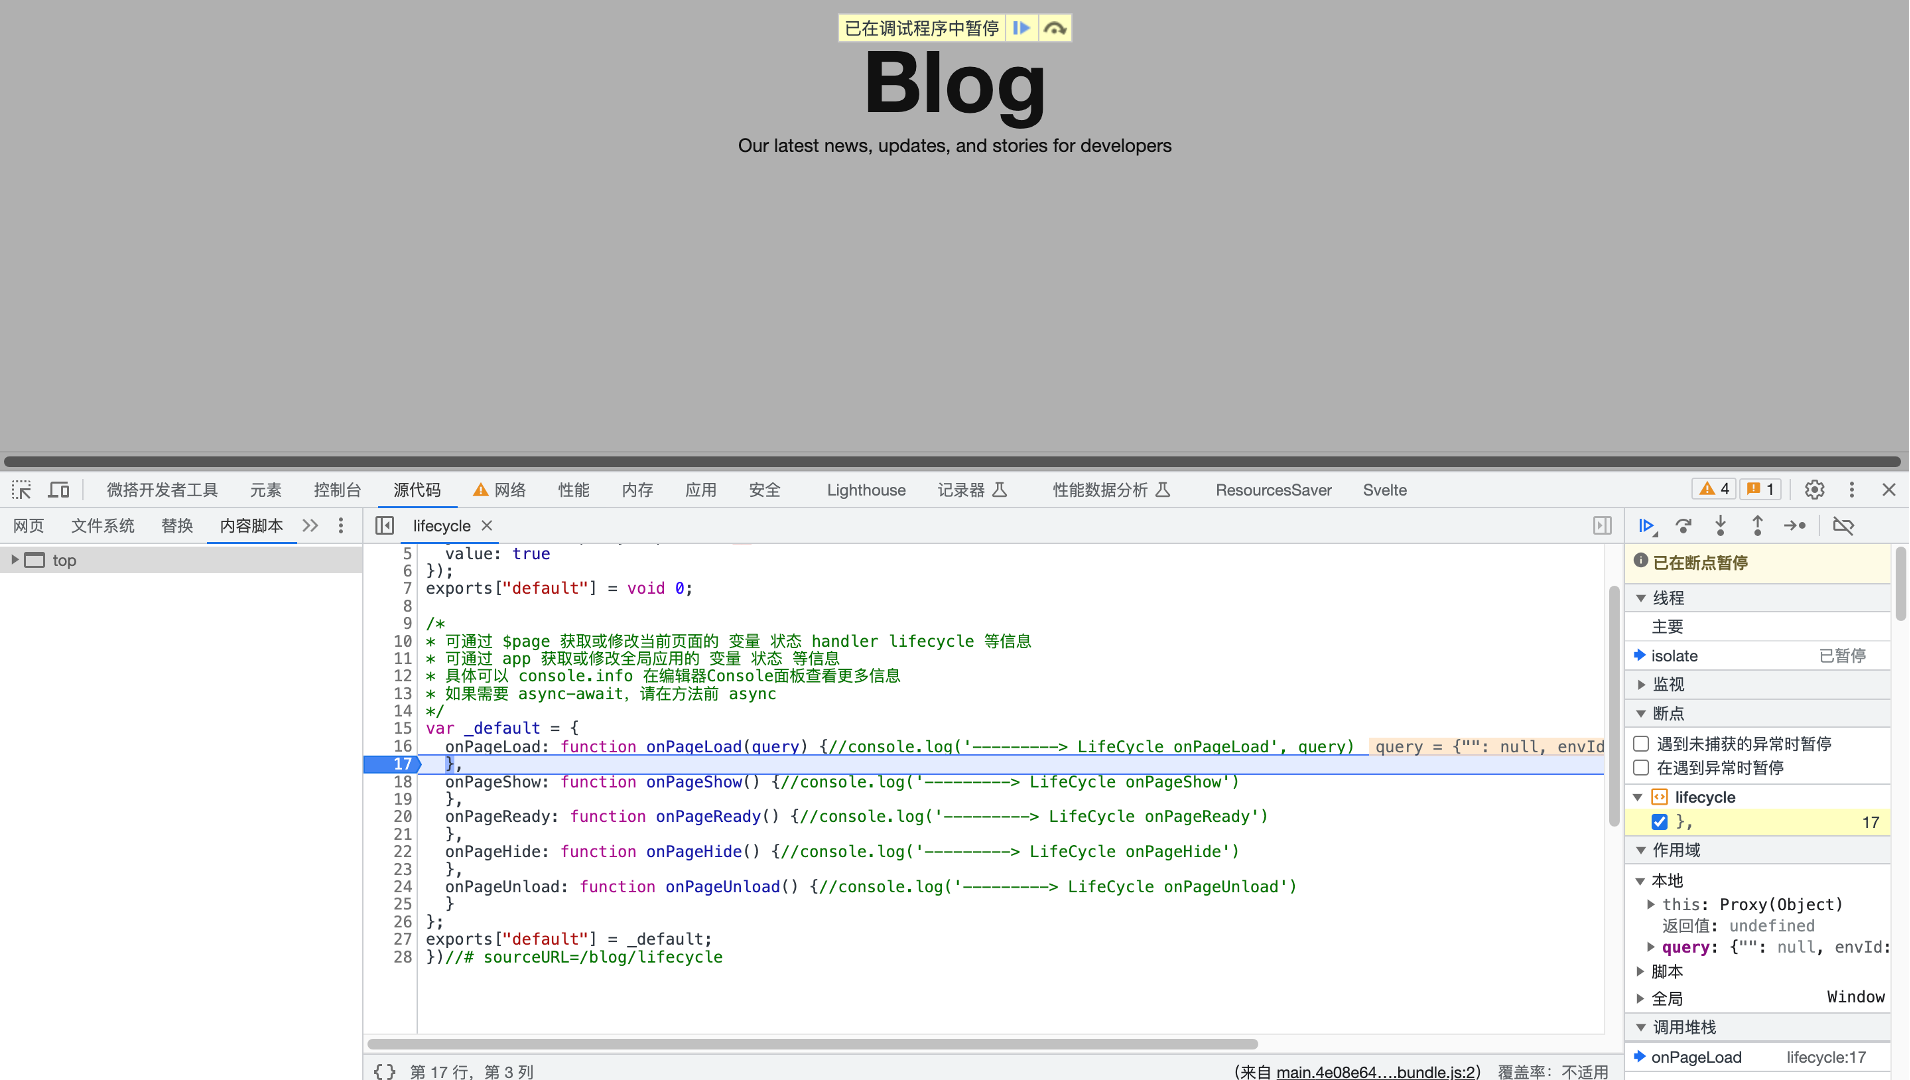
Using the Code Panel + Breakpoints to Debug Application Code
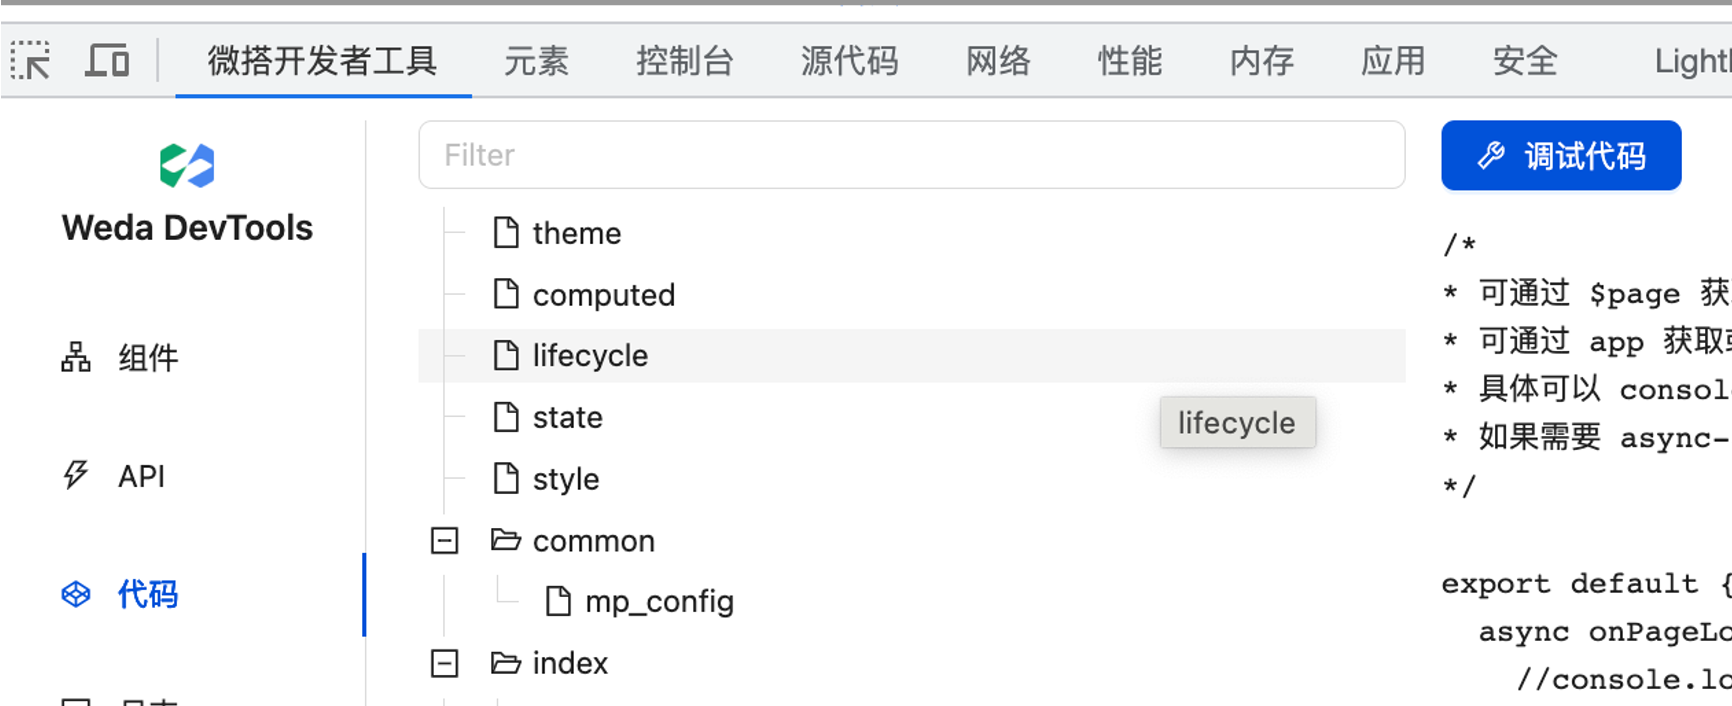
The Code panel displays the configured JS code and configurations in the application as a file tree. It offers a highly practical feature: to debug an event handler's code, you can directly locate the file without modifying any code, click the blue Debug code to quickly jump to the Sources panel in Chrome DevTools, and then set breakpoints for code debugging.
Other Web Application Debugging Tips
In addition to debugging real-time preview pages, for published Web applications, here are some additional application debugging tips:
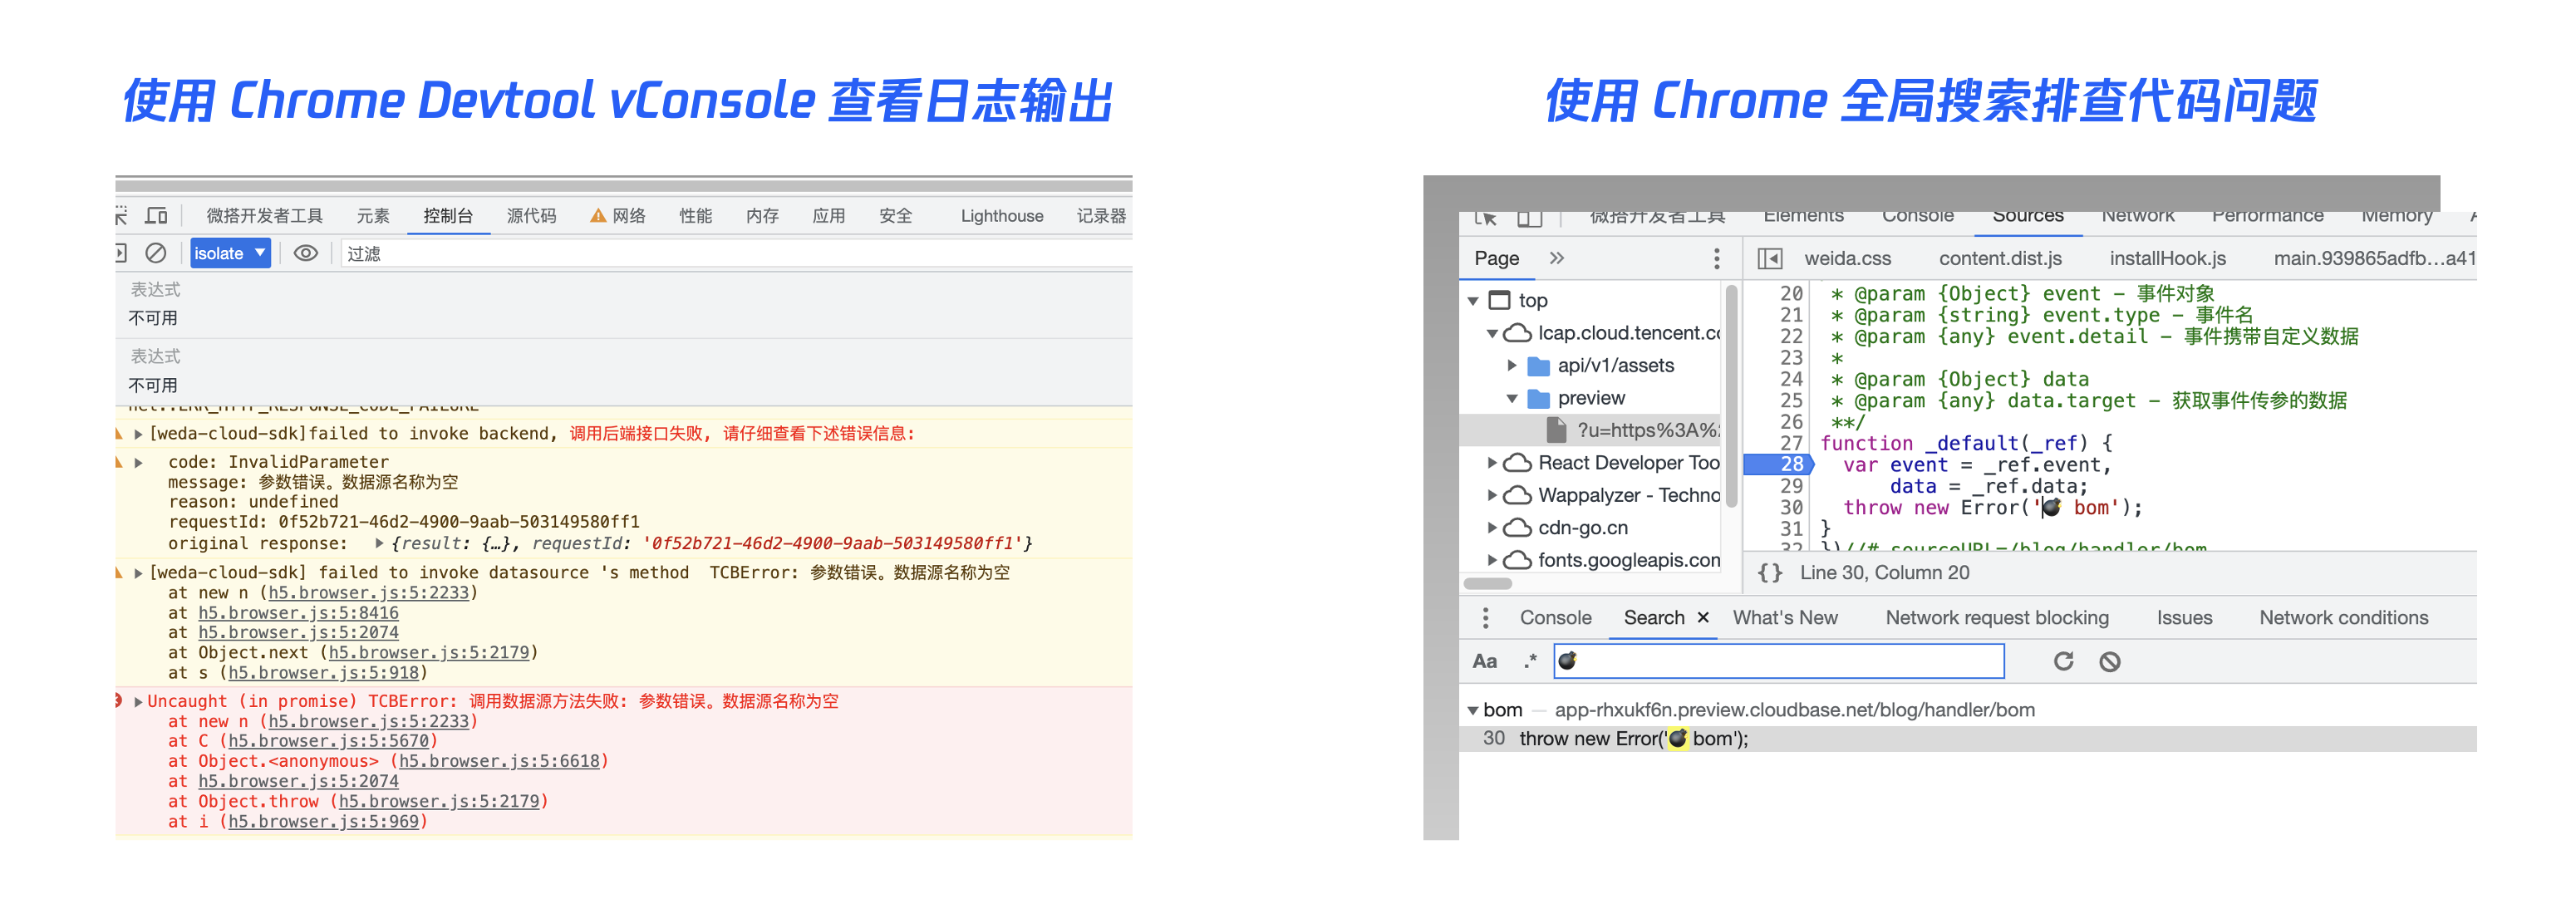
Using Chrome DevTools or vConsole to view log output
You can use browser developer tools, such as Chrome DevTools, Firefox, and Safari developer tools, switch to the Console panel to view debugging and error logs printed by the console.
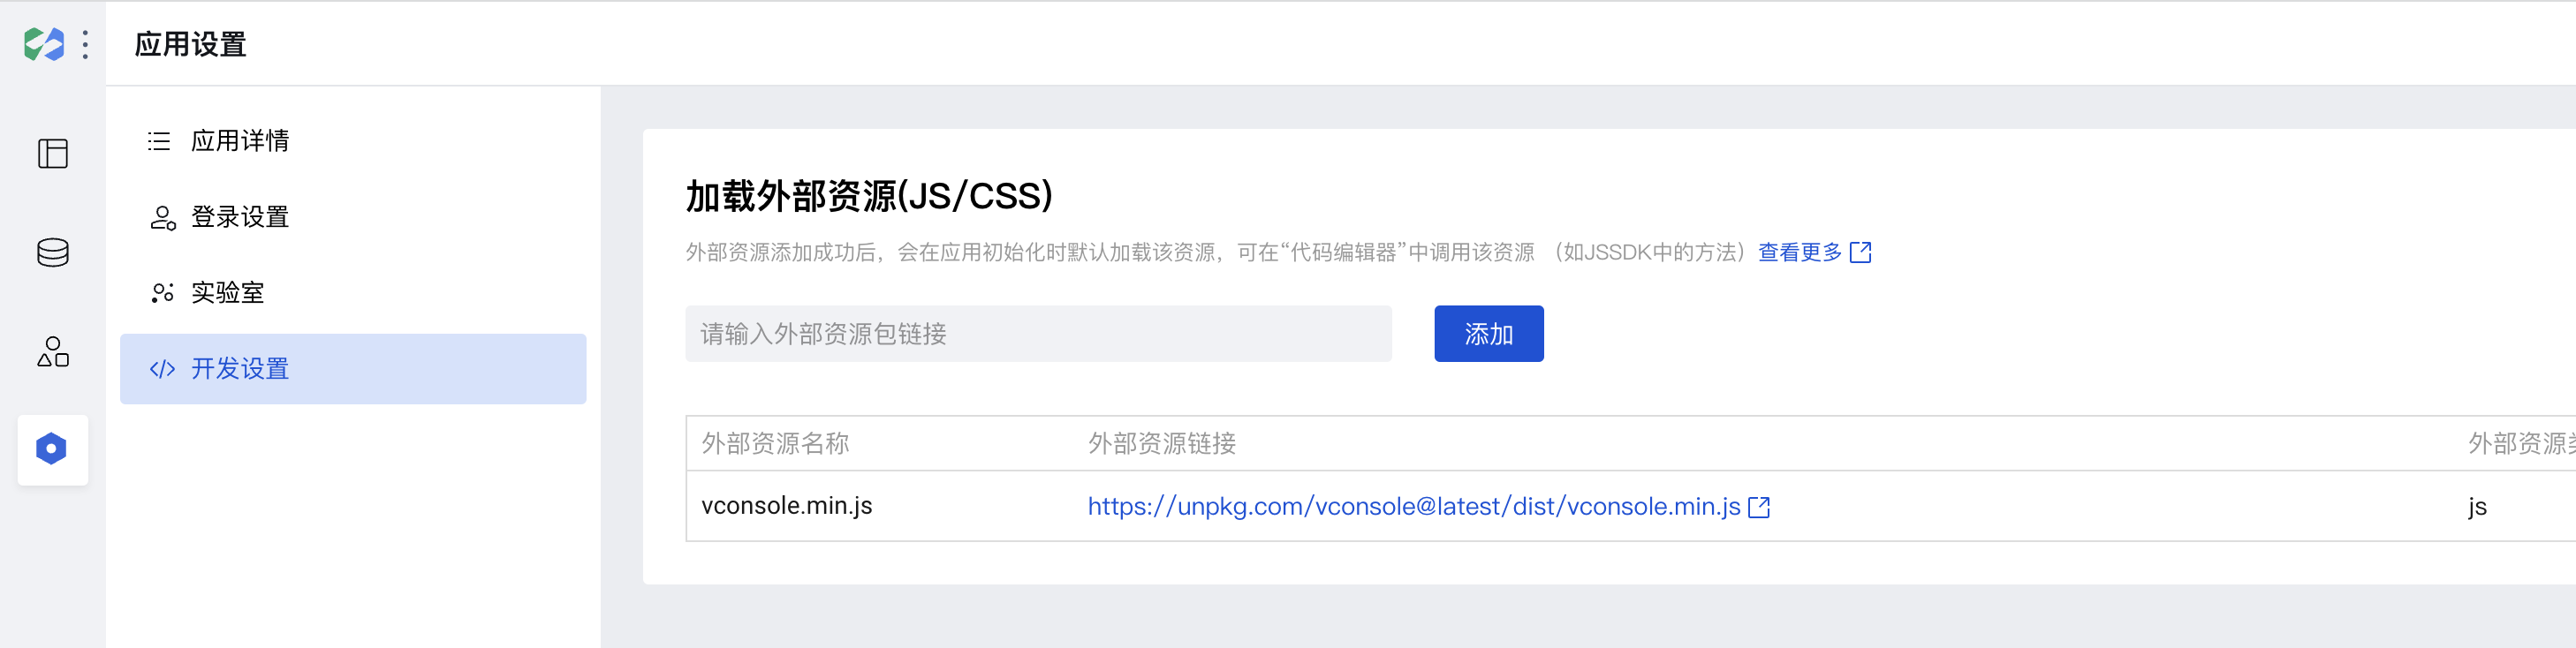
Alternatively, introduce the CDN JS of vConsole in the code configuration of the WeDa application editor to view runtime logs.
Using Chrome DevTools Global Search to Troubleshoot Code Issues
This is a very useful feature. When a page error occurs without stack information, you can use global search to locate potentially problematic code, then set breakpoints for debugging.
Open Developer Tools, click the Console tab, press ESC to pop up, click the three vertical dots on the left, select Search, and enter keywords to search.
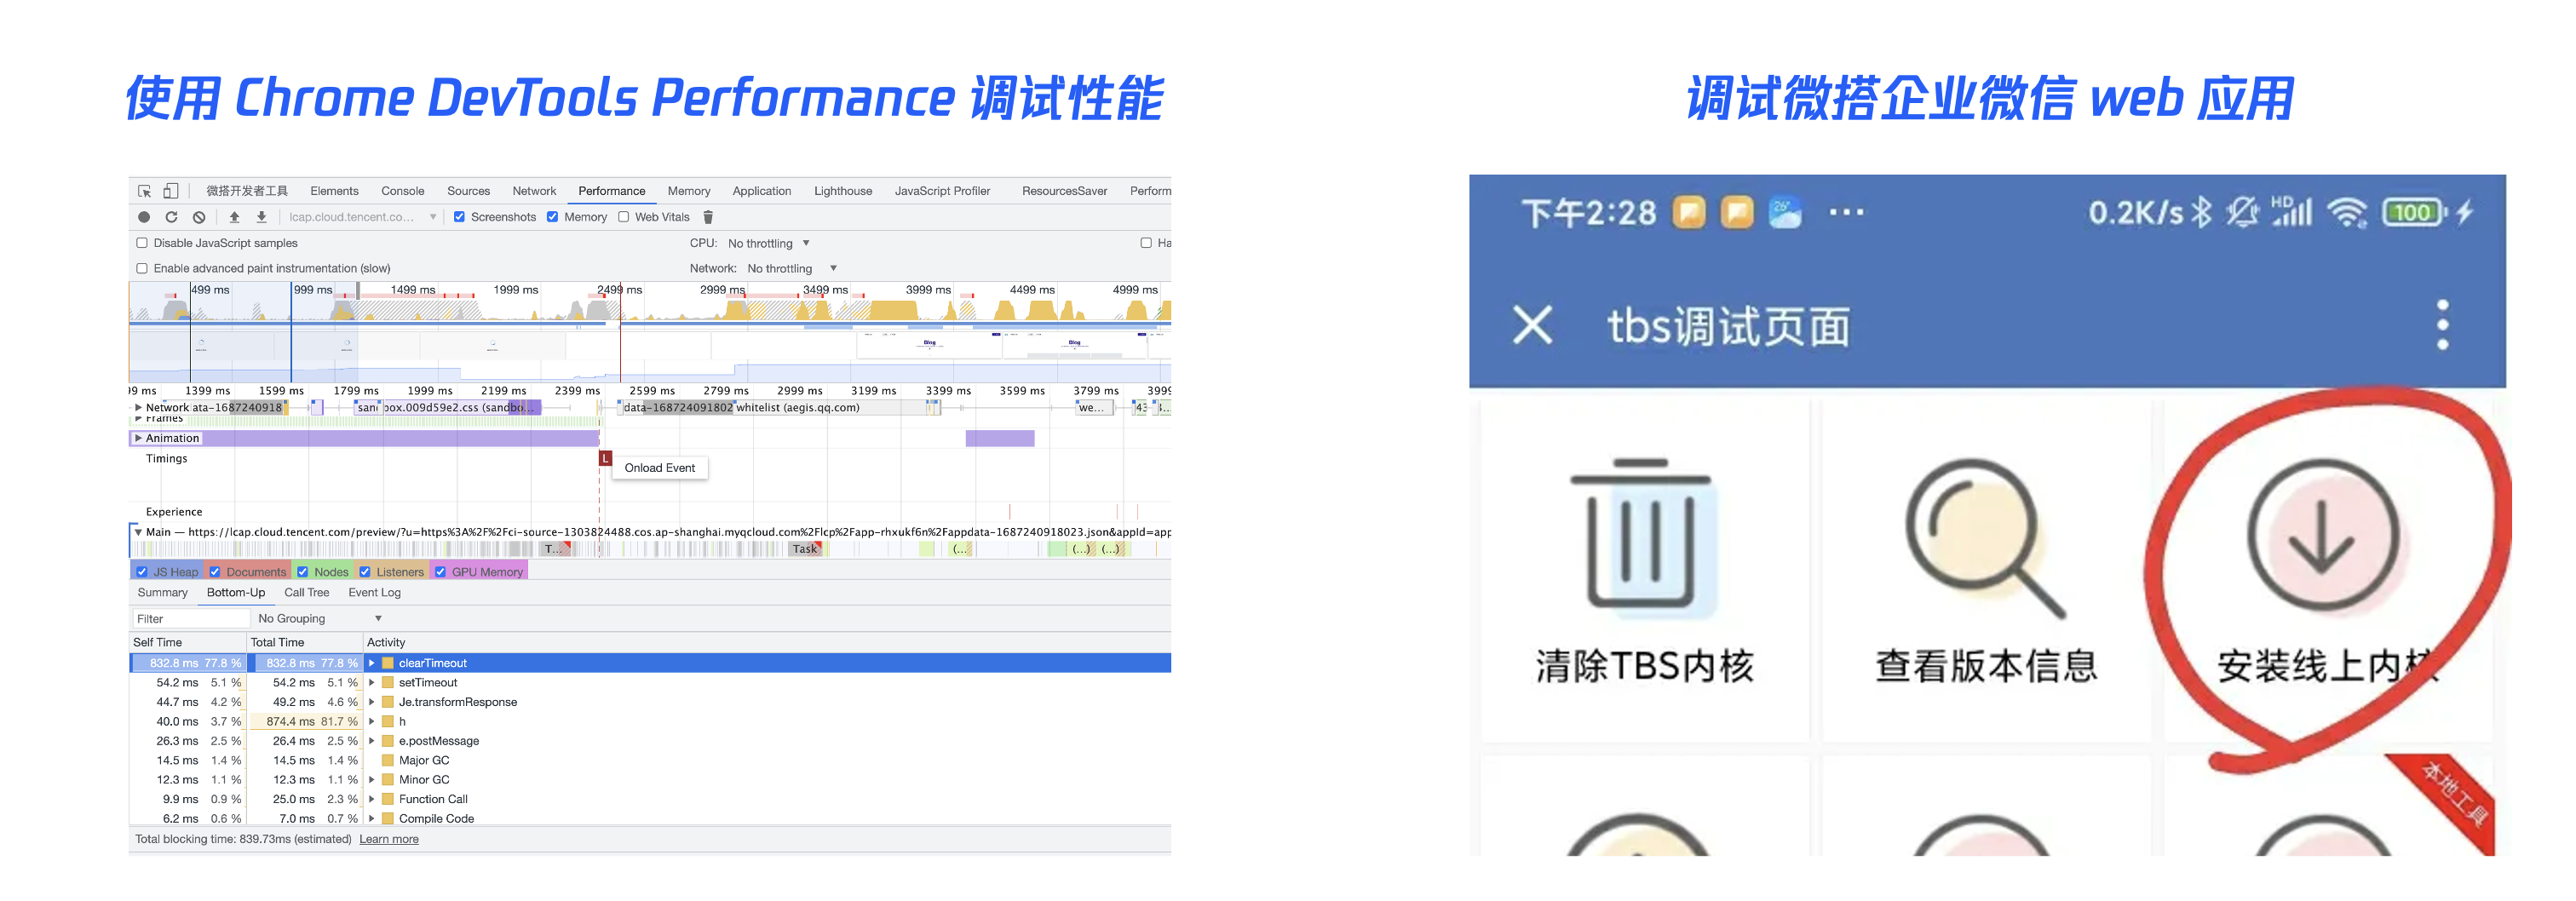
Using Chrome DevTools' Performance to Debug Application Performance
- Open the Performance panel: In Chrome DevTools, click the Performance tab, then click the record button in the lower-left corner to open the Performance panel.
- Conduct performance tests: In the Performance panel, you can perform performance tests to understand the application's performance bottlenecks and issues.
- Analyze performance data: In the Performance panel, you can view performance metrics including CPU usage, memory usage, network requests, etc., to analyze the application's performance bottlenecks and issues.
- Optimize the application: Based on performance data, optimizations and improvements can be implemented to enhance the application's performance and response speed.
Debugging WeDa Applications in WeChat Work
- For the desktop WeCom client, refer to the Client Debugging instructions in the official documentation to debug WeCom client applications on Windows/Mac.
- For WeCom Mini Programs on Android, you can debug applications in WeCom by referring to the X5 Kernel Debugging method.
WeDa Mini Program Application Debugging
How to debug mini program applications primarily includes two methods: vConsole and WeDa invoking IDE preview.
Debugging Trial Version Mini Programs with vConsole
Steps to Open vConsole
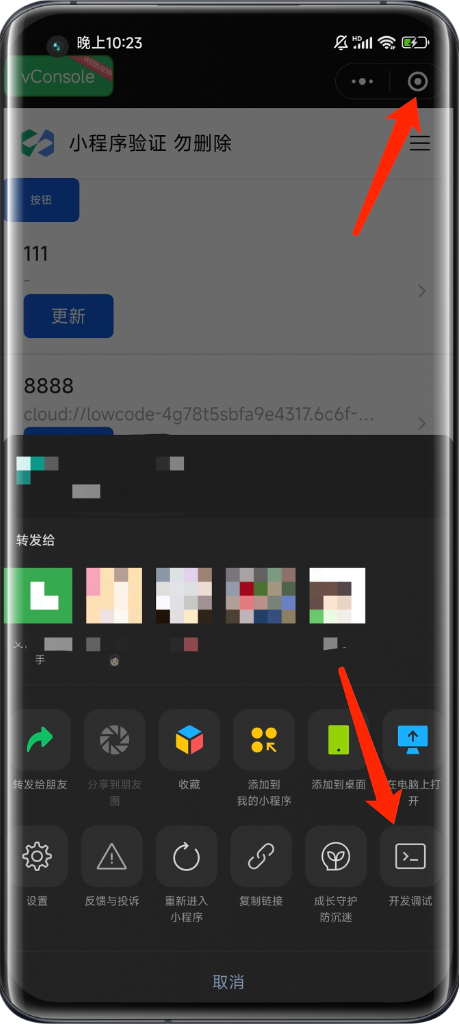
- Click the three-dot button in the capsule menu
- Click Development Debugging
- Click Open Debugging in the Development Debugging Panel
- After reloading the mini program, a green floating vConsole icon will appear. Click it to open the debug panel.
Debugging Mini Program Logs with the Log Panel
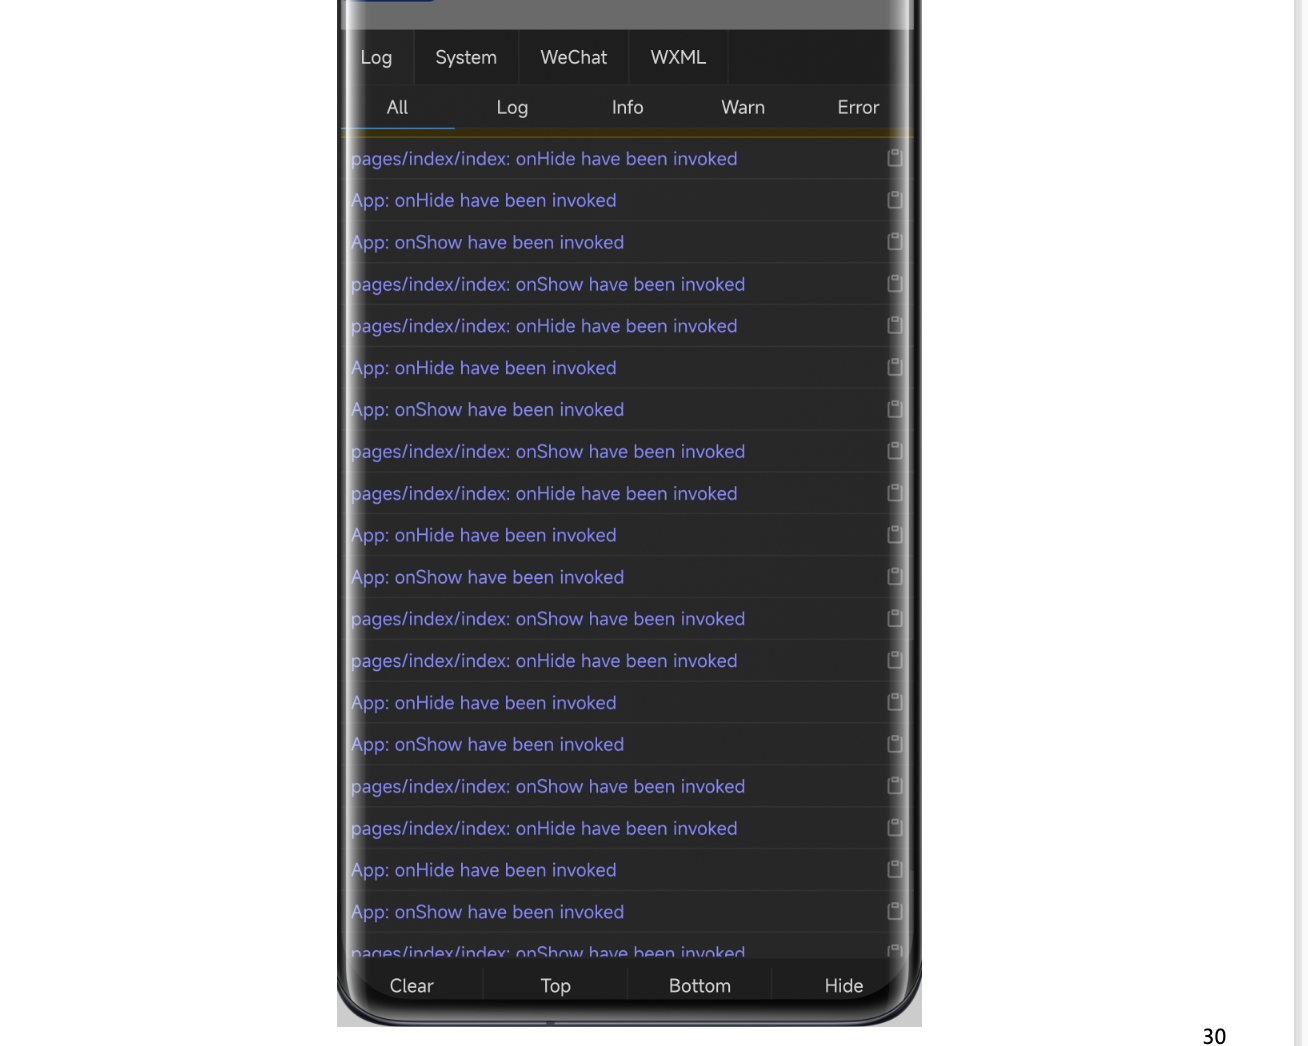
- View the log information output in the mini program. You can filter log information using the filter to facilitate better viewing and debugging.
- Execute the command to print relevant variables. Access the
$wnamespace viagetApp().app.__internal__.$w. Refer to the $w API documentation to access other APIs. For example, retrieve the page variablevar1usinggetApp().app.__internal__.$w.page.dataset.state.var1. - Developers can also call
console.login custom code to print log content, which will be displayed in vConsole. However, the content is converted to a JSON string before being transmitted to vConsole, so the displayed content in vConsole will have some limitations.
Debugging Runtime State and Styles Using the WXML Panel
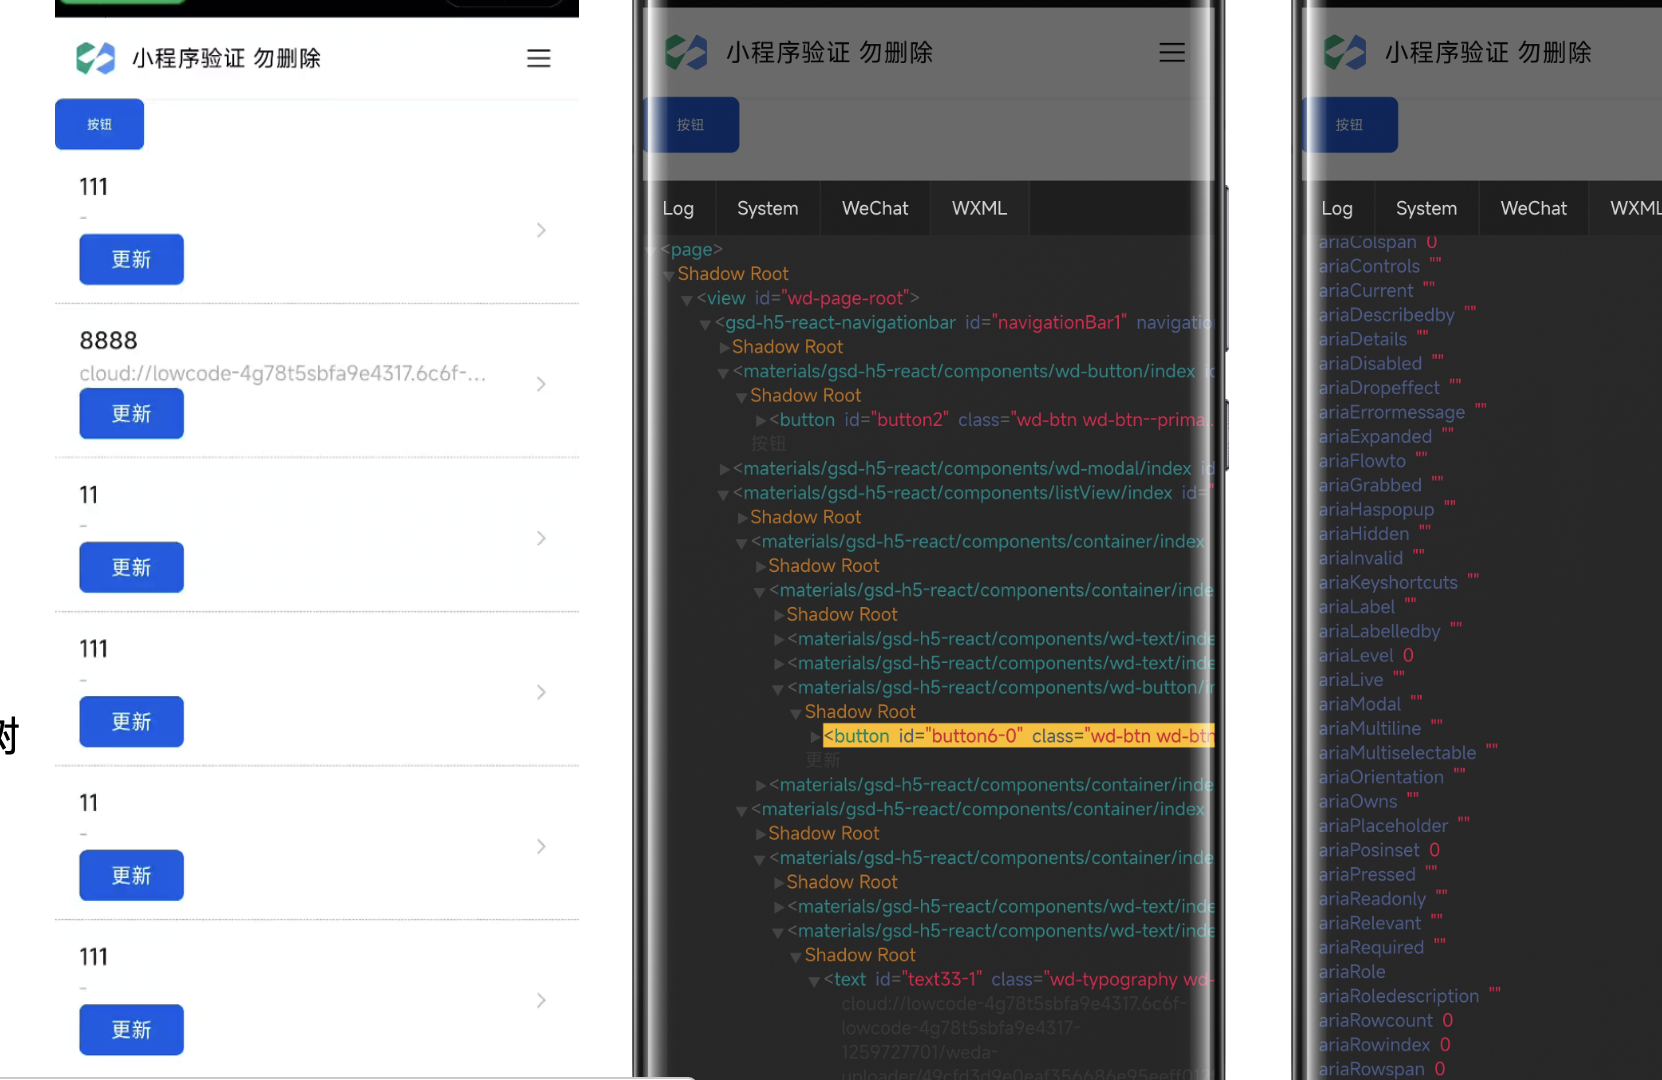
Debugging Steps
- Click Click Select
- Select the node on the page
- View runtime properties/style, etc.
- Click Tree/Details to switch between details and component tree.
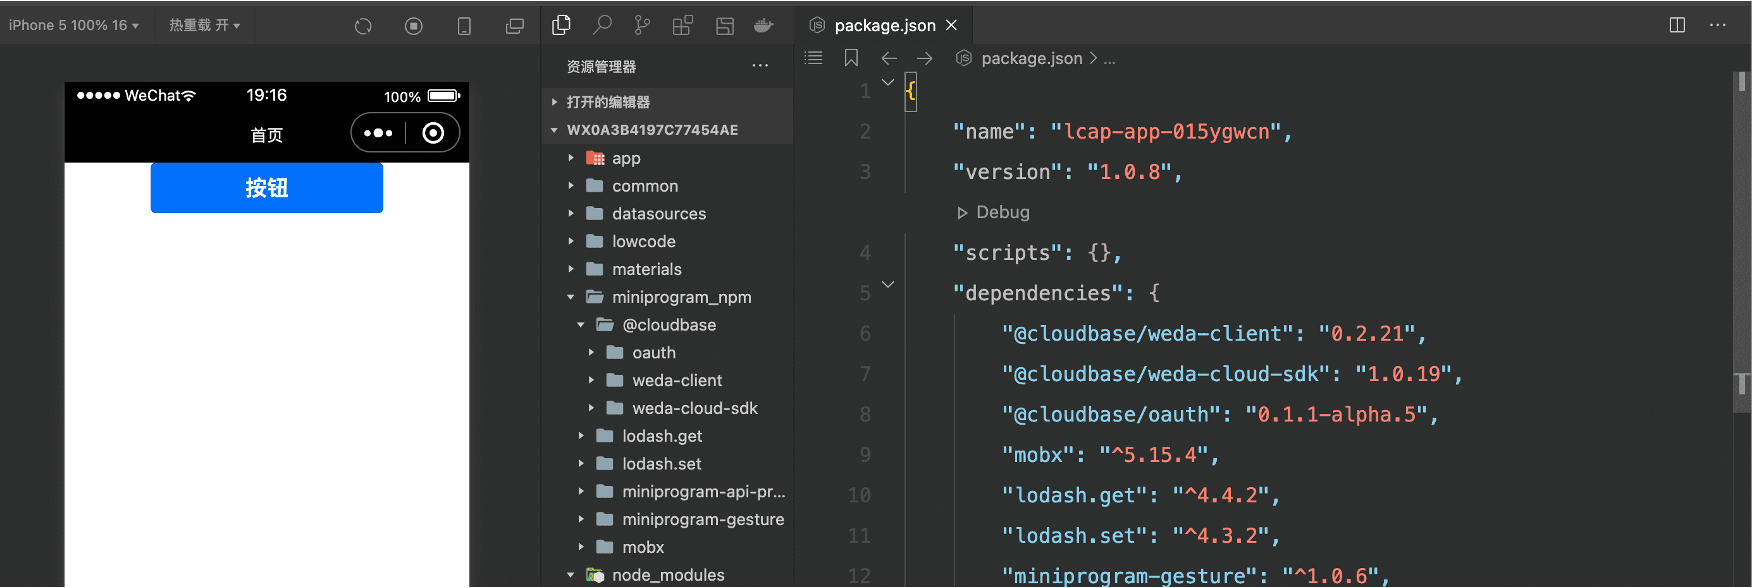
Previewing and Debugging Mini Programs with WeChat Developer Tools
vConsole's functionality is relatively limited. For breakpoint debugging during runtime, you still need to use WeChat Developer Tools. The WeDa Editor supports launching WeChat Developer Tools for debugging. After editing the application in WeDa Editor, click the WeChat Developer Tools Preview button to synchronize application features to the local WeChat Developer Tools.
For details, you can refer to the WeChat Developer Tools Preview documentation.
Compared with vConsole:
- Supports breakpoint debugging
- Supports real-time compilation when modifying code
- Cannot simulate Mini Program native APIs in the IDE.
The above are some practical tips for application debugging in WeDa. We have covered common debugging tools and principles, as well as debugging techniques for web and Mini Program applications.
Basic Debugging Methods
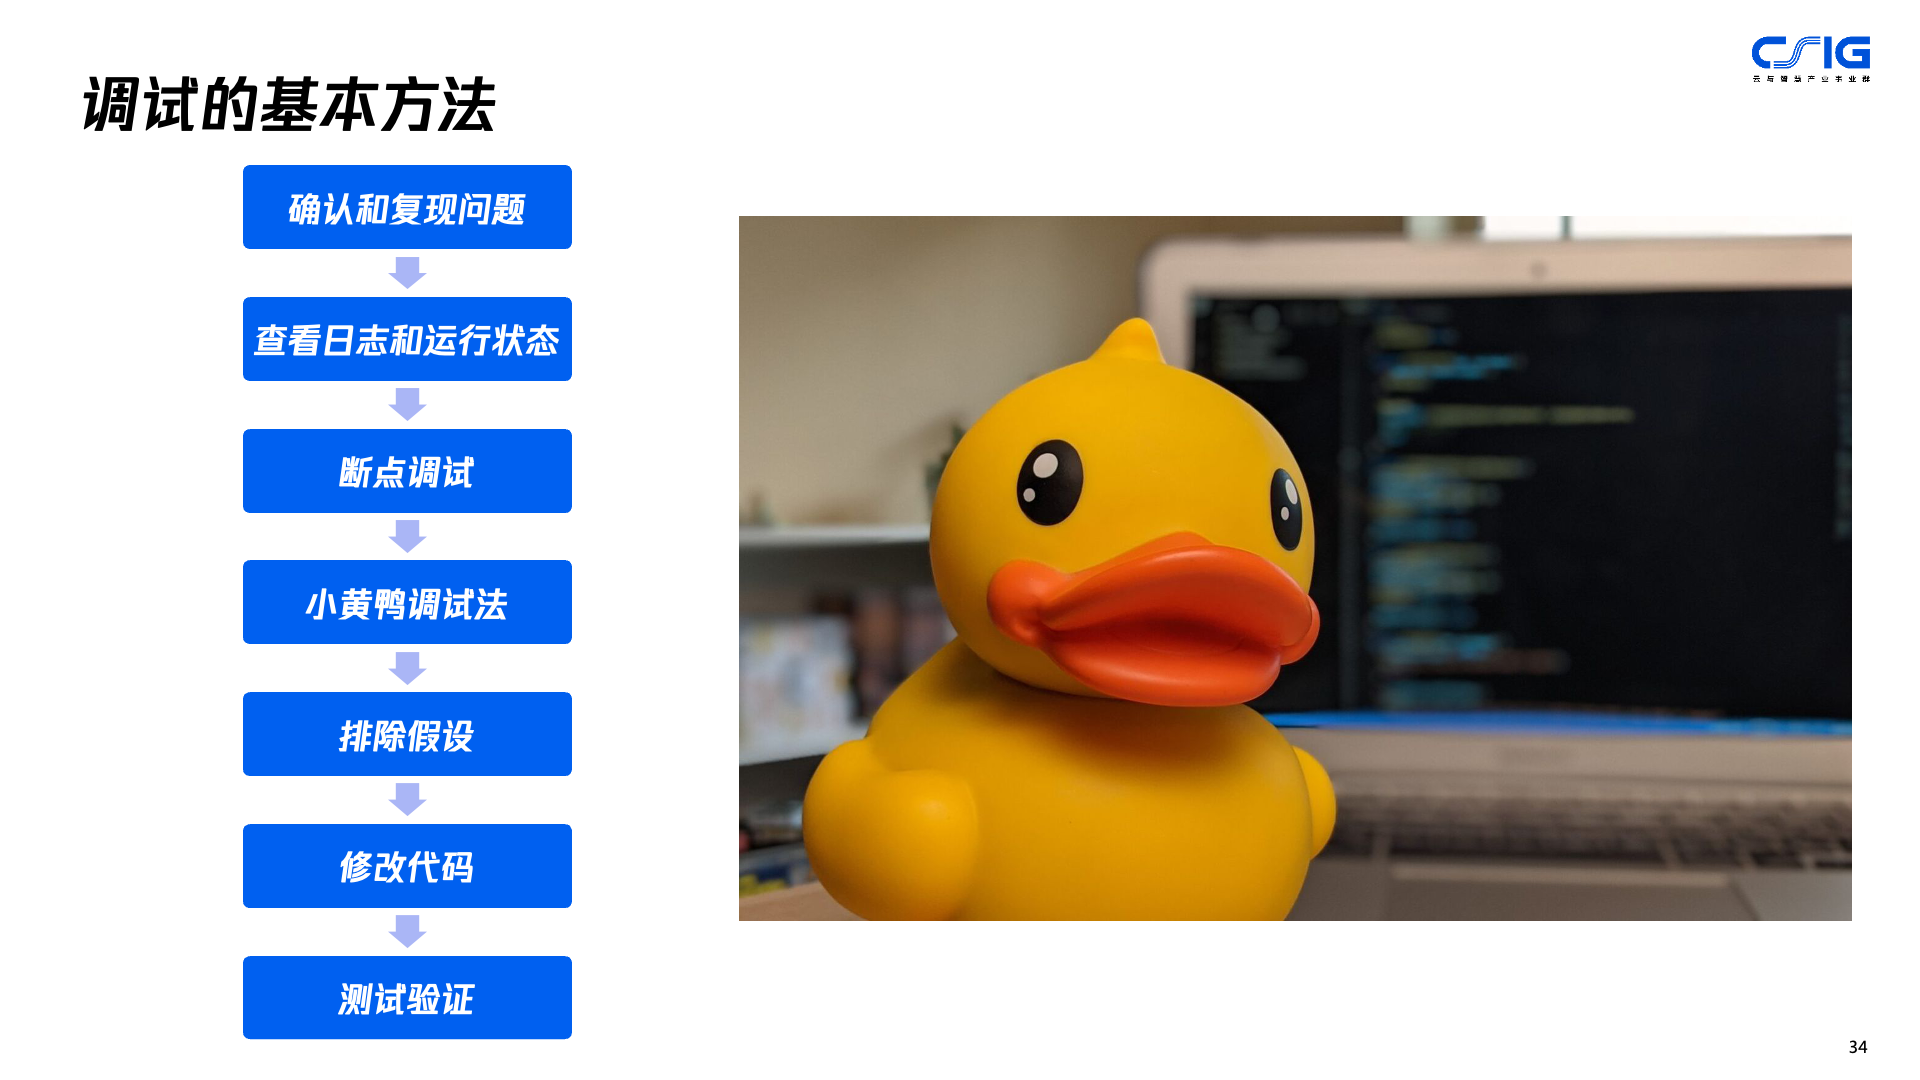
- Confirm and Reproduce the Issue: During debugging, the first step is to confirm and reproduce the issue in order to understand its specific circumstances and causes.
- Check Logs and Runtime Status: After confirming and reproducing the issue, it is necessary to check logs and runtime status to understand the specific manifestations and impact of the problem.
- Breakpoint Debugging: After checking logs and runtime status, you can use breakpoint debugging to progressively troubleshoot and locate errors.
- Rubber Duck Debugging: When breakpoint debugging fails to resolve the issue, you can employ rubber duck debugging, which involves describing the problem to a virtual rubber duck to facilitate thinking and problem-solving.
- Eliminate Assumptions: After using rubber duck debugging, you can eliminate certain assumptions based on the specific circumstances of the issue to more accurately locate and resolve the problem.
- Modifying Code: After eliminating assumptions, you can modify the code based on the specific circumstances of the issue to resolve the problem and optimize the application.
- Test Verification: After modifying the code, it is necessary to perform test verification to ensure that the modified code can run normally and resolve the issue.
Video Courses
Efficiency Booster: How to Debug WeDa Low-Code Applications More Efficiently