H5 Debugging Guide
Overview
Debugging H5 applications on mobile is more challenging than on desktop, and the main reasons include:
- You cannot directly use the developer tools of desktop browsers
- Variations in mobile device performance and network environments
- Touch interaction and screen adaptation issues
- Compatibility differences across various mobile browsers and WebViews
This guide focuses on how to use tools like VConsole for debugging H5 applications on mobile within WeDa.
Debugging with VConsole
VConsole is a lightweight, extensible front-end developer debugging panel for mobile web pages, open-sourced by Tencent, and is particularly suitable for debugging on mobile devices.
Installing and Integrating VConsole
Using in WeDa Application
In the WeDa application editor, VConsole can be introduced in the following ways:
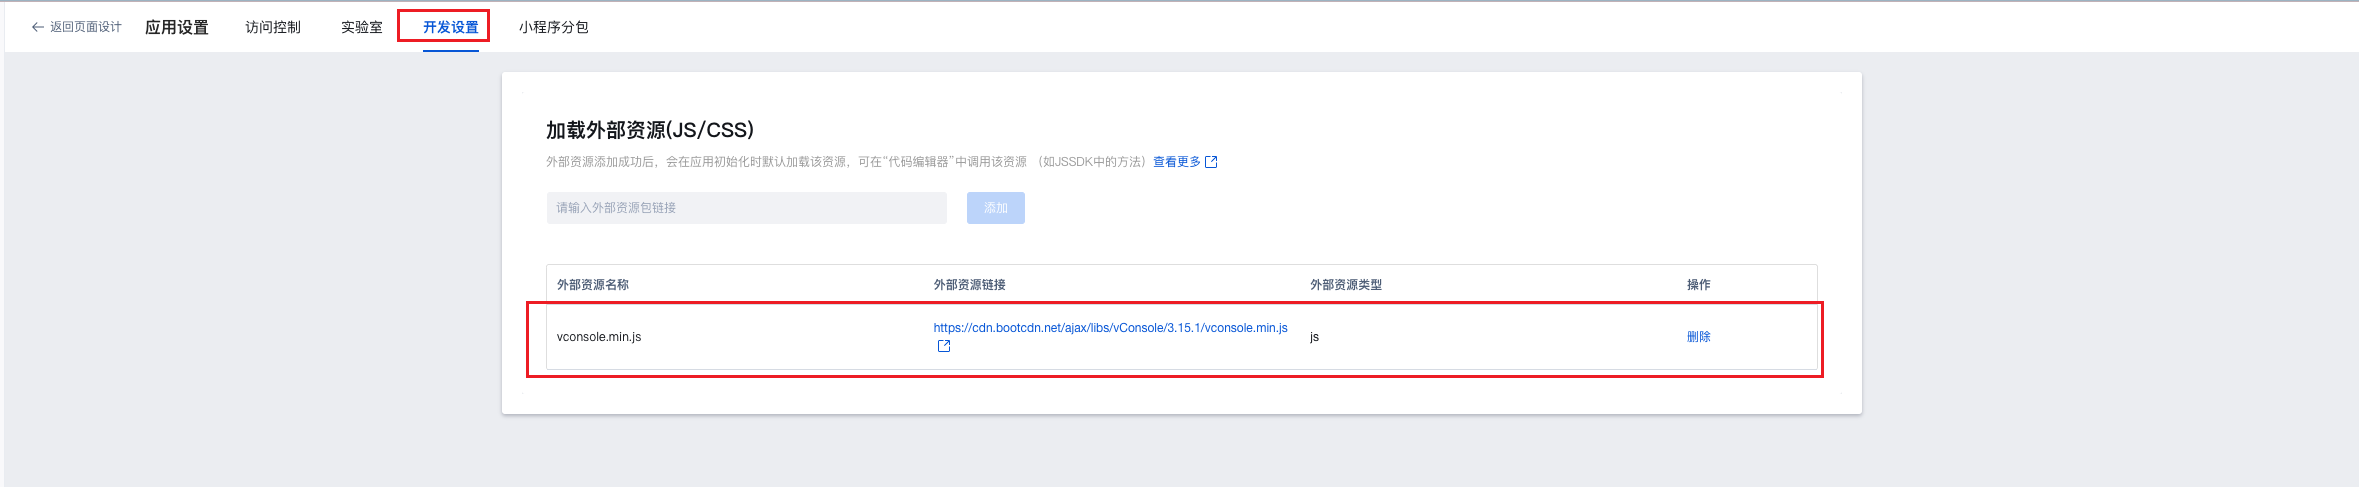
Step 1: Add in Application Settings
In the "Development Settings" section of the application settings, add:
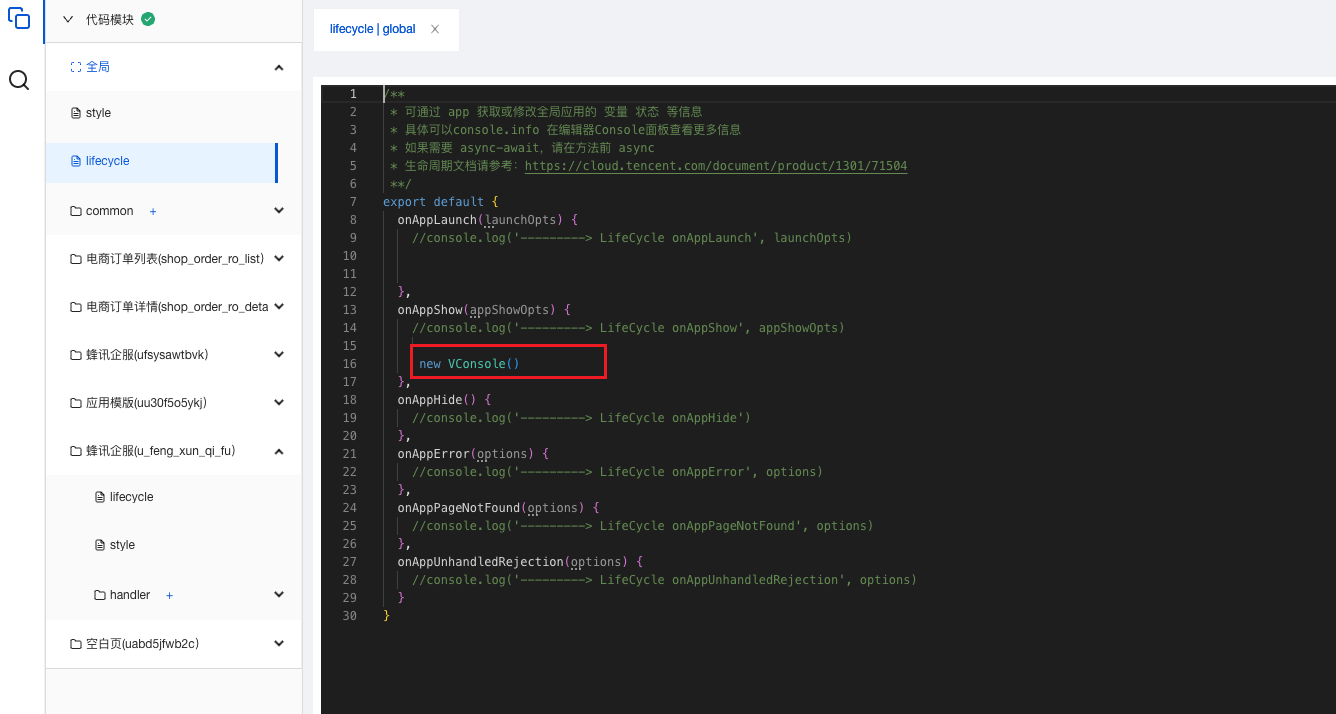
Step 2: Dynamically Load in Page Lifecycle
In page lifecycle events, use new VConsole() to dynamically load:
Showcase
Introduction to the VConsole Feature Panel
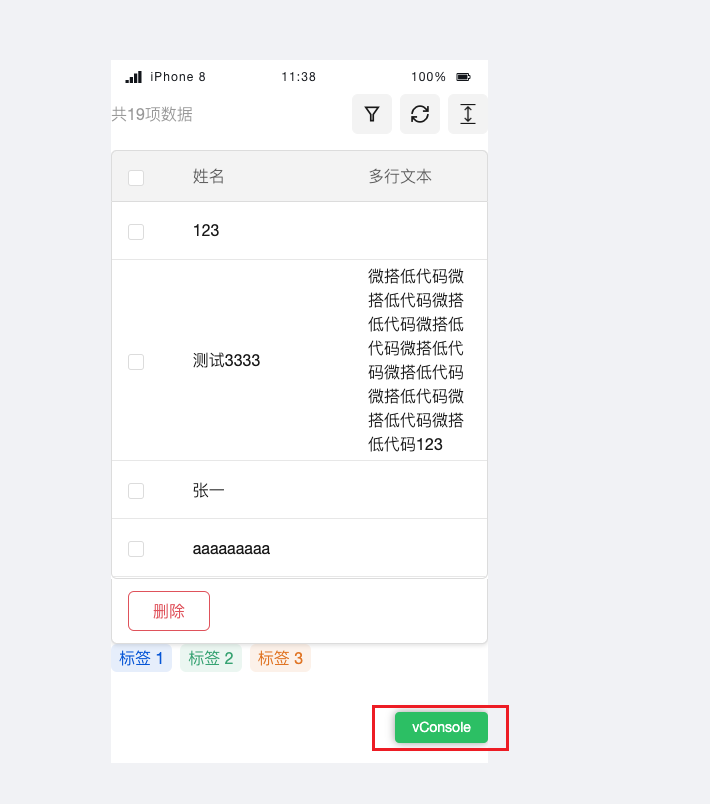
After VConsole is launched, a green floating button will appear in the lower-right corner of the page. Clicking it opens the debugging panel, which includes the following features:
1. Log Panel
- Feature: View the console output log information
- Use Case: Debug JavaScript code, view variable values and program execution flow
- Tips:
- Supports
console.log,console.warn,console.error, etc. - Filter different types of logs using the filter
- Supports clearing log records
- Supports
// Example: Add debugging logs in the code
console.log("Page loaded");
console.warn("This is a warning message");
console.error("This is an error message");

// Print objects and arrays
const userInfo = { name: "Zhang San", age: 25 };
console.log("User information:", userInfo);
2. System Panel
- Feature: Display system information and basic page information
- Information Included:
- User Agent
- Screen resolution
- Network type
- Page URL
- WeDa Application related information
3. Network Panel
- Feature: Monitor network requests
- Use Case: Debug API interface calls, view request parameters and response data
- Features:
- Display the request method, URL, and status code
- View request headers and response headers
- View request parameters and response data
- Support copying request information
4. Element Panel
- Feature: View and modify page elements
- Use Case: Debug page layout and style issues
- How to:
- Click the element selector to select the page element
- Inspect the HTML structure of elements
- Modify element styles in real time
5. Storage Panel
- Feature: View and manage local storage
- Content Included:
- Cookies
- LocalStorage
- SessionStorage
- Supports viewing, editing, and deleting storage data
Custom Configuration and Deletion
Custom Configuration
const vConsole = new VConsole({
  theme: "dark", // Theme settings
  defaultPlugins: ["system", "network", "element", "storage"], // Enabled plugins
  maxLogNumber: 1000, // Maximum number of log entries
  onReady: function () {
    console.log("VConsole is ready");
  },
});
Destroy Instance
When debugging is complete, remember to remove the VConsole-related code:
// Destroy the VConsole instance
if (window.vConsole) {
  window.vConsole.destroy();
}
Notes
- Performance Impact: VConsole may have some impact on page performance. It is recommended to use it only during the development and testing phases
- Security Considerations: Do not enable VConsole in production environments to prevent exposure of sensitive information
- Compatibility: VConsole supports most modern mobile browsers, including the WeChat built-in browser
- Log Volume: Avoid outputting too many logs, as it may affect page performance and user experience.
Summary
By properly using VConsole and other debugging tools, you can significantly enhance the debugging efficiency of mobile H5 applications. During actual development, it is recommended to:
- Development Phase: Use VConsole for real-time debugging
- Testing Phase: Verify features by combining with real device debugging
- Production Phase: Remove all debugging code to ensure performance and security
Remember that good debugging habits and proper tool usage can help quickly locate and resolve issues, improving development efficiency and application quality.