Testing, Logging and Monitoring
This document details how to use the testing, log viewing, and monitoring features provided by TCB to help developers efficiently debug and monitor the running status of cloud functions.
Prerequisites
Before testing and monitoring the cloud function, make sure:
- The Tencent Cloud TCB environment has been created
- At least one cloud function has been deployed
- Appropriate access permissions have been granted
Cloud Function Testing
TCB provides multiple cloud function testing methods, supporting online debugging and local testing to help developers debug code more conveniently.
- CloudBase Console
- WeChat DevTools
Console Testing
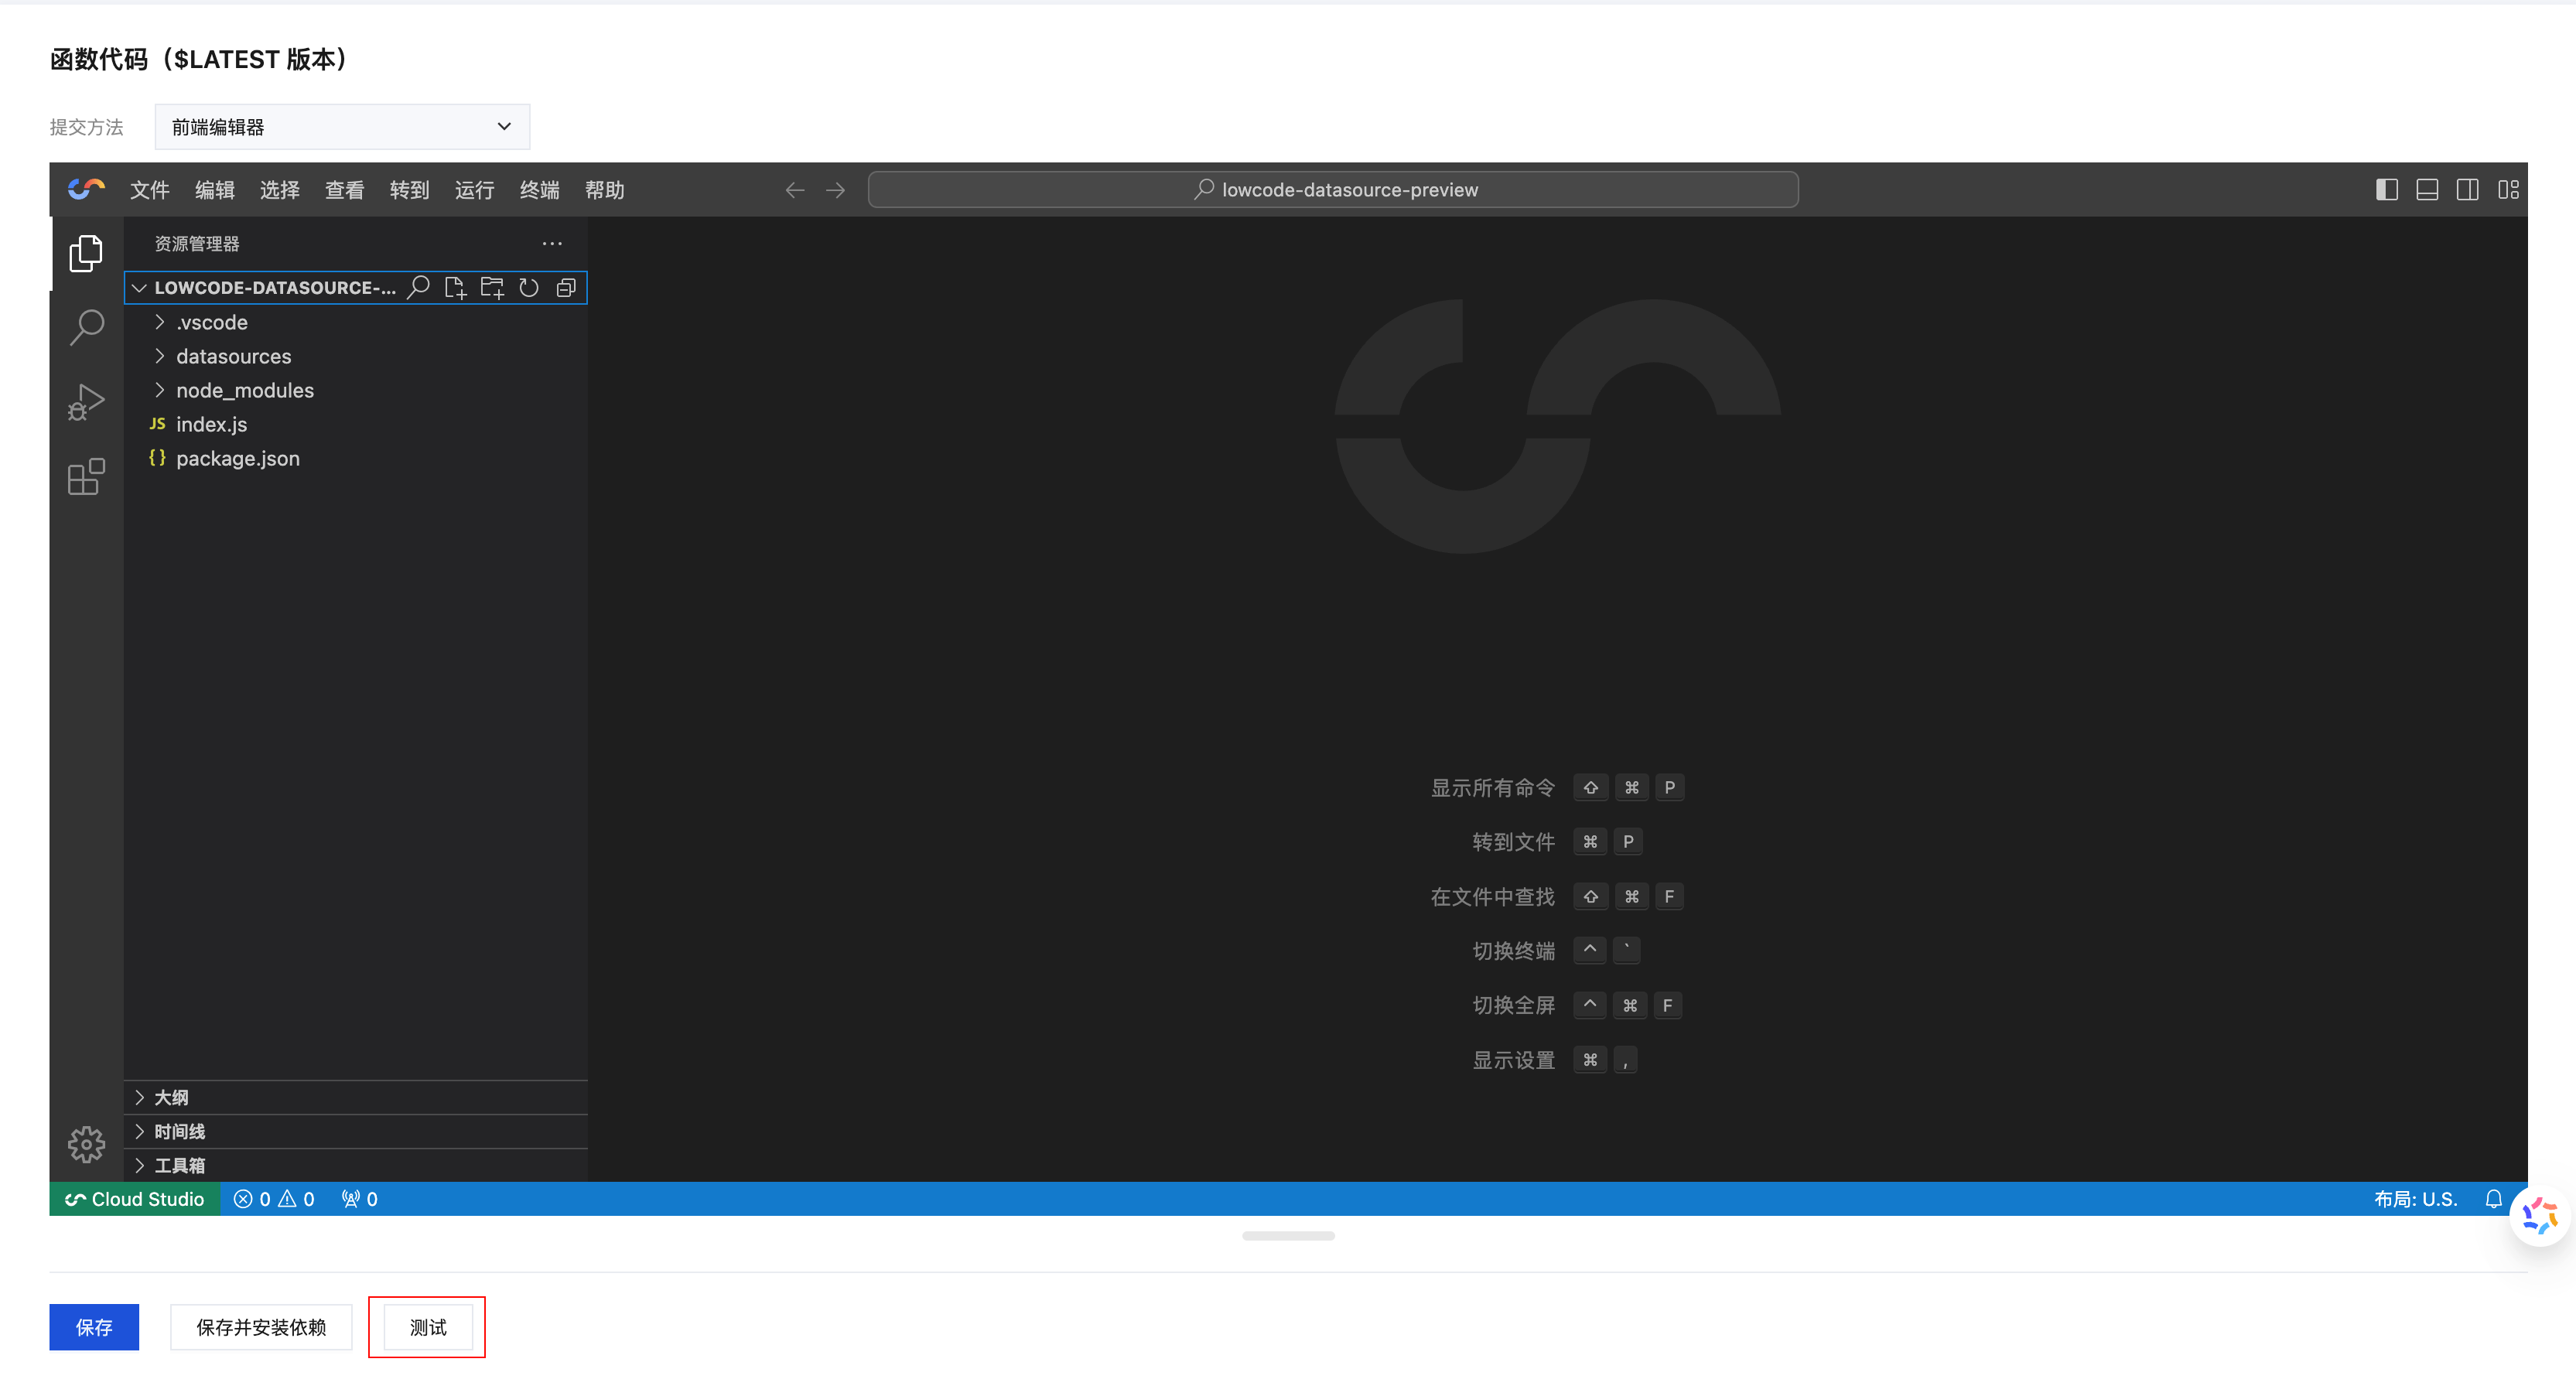
Through the TCB console, you can quickly test the execution of cloud functions.
Test Steps
- In the console's corresponding cloud function management panel, click the 'Test' button to open the test pop-up.
- Select a test template or customize test parameters
- Click 'Execute' to run the test
- View the execution result and log output
Test Parameter Configuration
Use template parameters
- Click the 'Submit Method' dropdown menu and select the template method for the test function
- Template parameters are passed to the function as the
eventparameter during testing
Custom parameters Enter JSON-formatted test data in the test parameter editor:
{
  "name": "test",
  "data": {
    "key": "value",
    "number": 123
  }
}
Local Debugging Tools
In addition to the visual testing feature, you can also use the command-line tool scf-cli for local debugging:
# Install scf-cli
npm install -g scf-cli

# Local Debugging Function
scf local invoke --template template.yaml --event event.json
WeChat Developer Tools Testing
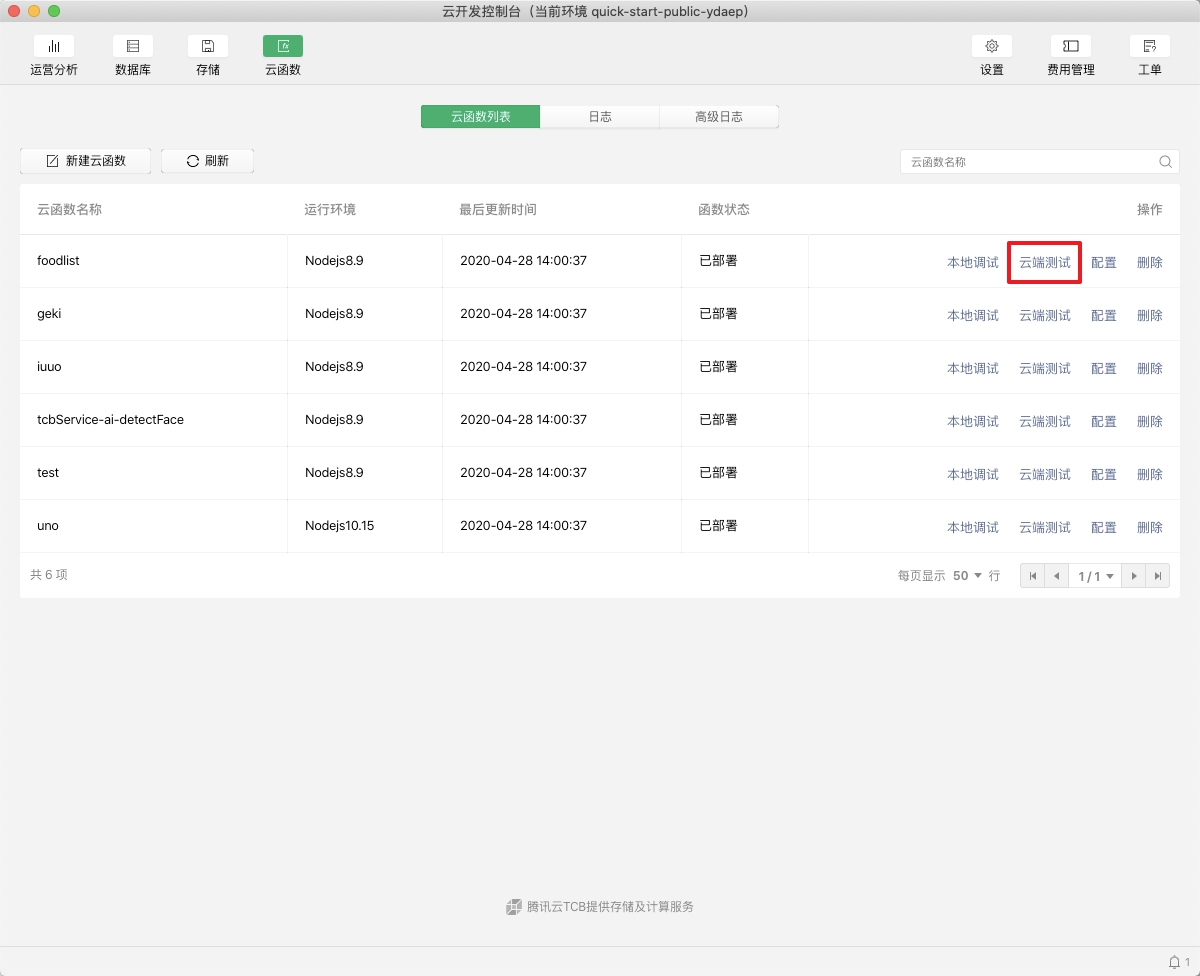
In the WeChat Developer Tools, you can directly test cloud functions.
Test Steps
- In the console's corresponding cloud function management panel, click 'Cloud Test' to open the test pop-up.
- Configure test parameters
- Click 'Execute' to run the test
- View the execution result
Parameter Configuration Description
- Submit Method: Select the template method for the test function. Currently supports the
Hello Worldevent template - Test Parameters: Enter JSON-formatted test parameters in the editor
- Run Result: After execution is completed, the result will be displayed in the "Run Test" section.
Local Debugging Support
WeChat Developer Tools also support using scf-cli for local rapid debugging.
Log Viewing
TCB provides a comprehensive logging system to help developers quickly locate and resolve issues.
Log Features
- Real-time Logs: Supports real-time viewing of function execution logs
- Structured Display: Log information is presented in a structured format for easy analysis.
- Multi-dimensional Filtering: Supports filtering logs by conditions such as time and status.
- Detailed Information: Includes detailed information such as request ID, execution time, and memory usage.
- CloudBase Console
- WeChat DevTools
Console Log Viewing
- Log in to the TCB console
- Go to the corresponding cloud function management page
- Click the "Log" tab
- Select a time range to view log records.

Log Information Description
Each log record contains the following information:
- Timestamp: the specific time of function execution
- Request ID: the unique identifier for a function invocation
- Execution status: success or failure status
- Execution duration: the time consumed by function execution
- Memory usage: memory footprint during function execution
- Log content: content output by console.log, etc., in the function
WeChat Developer Tools Logs
View cloud function logs in the WeChat Developer Tools:
- Open the WeChat Developer Tools
- Go to the TCB console
- Select the corresponding cloud function
- Click "Logs" to view execution records

Log Best Practices
Structured Logging
Use structured logging in function code:
exports.main = async (event, context) => {
  const requestId = context.requestId;

  // Record the start of the request
  console.log(JSON.stringify({
    level: 'INFO',
    requestId,
    message: 'Function execution started',
    timestamp: new Date().toISOString(),
    event: event
  }));

  try {
    //Business logic.
    const result = await processData(event);

    // Record the successful result
    console.log(JSON.stringify({
      level: 'INFO',
      requestId,
      message: 'Function executed successfully',
      result: result
    }));

    return result;
  } catch (error) {
    // Log error
    console.error(JSON.stringify({
      level: 'ERROR',
      requestId,
      message: 'Function execution failed',
      error: {
        message: error.message,
        stack: error.stack
      }
    }));

    throw error;
  }
};
Log Level Usage
Properly use different log levels:
// General information
console.log('General log message');

// Important information
console.info('Important information level log');

// Warning message
console.warn('Warning level log');

// Error message.
console.error('Error level log');
- Avoid recording sensitive information (such as passwords, keys, etc.) in logs.
- Properly control the log output volume to avoid generating excessive logs.
- Use structured log format to facilitate subsequent analysis and processing.
Monitoring Data
TCB provides comprehensive monitoring metrics to help developers understand the operational status and performance of cloud functions.
Monitoring Metrics
Cloud function monitoring includes the following core metrics:
- Invocations: The total number of times the function is called.
- Runtime: The average and maximum execution time of the function.
- Errors: The count of function execution failures.
- Success Rate: The percentage of successful function executions.
- Memory usage: Memory footprint during function execution
- Concurrency: The number of simultaneously executing function instances
- CloudBase Console
- WeChat DevTools
Console Monitoring View
- Log in to the TCB console
- Go to the corresponding cloud function management page
- Click the Monitoring tab
- Select a time range to view monitoring data.
- Click Export Data to export monitoring data.
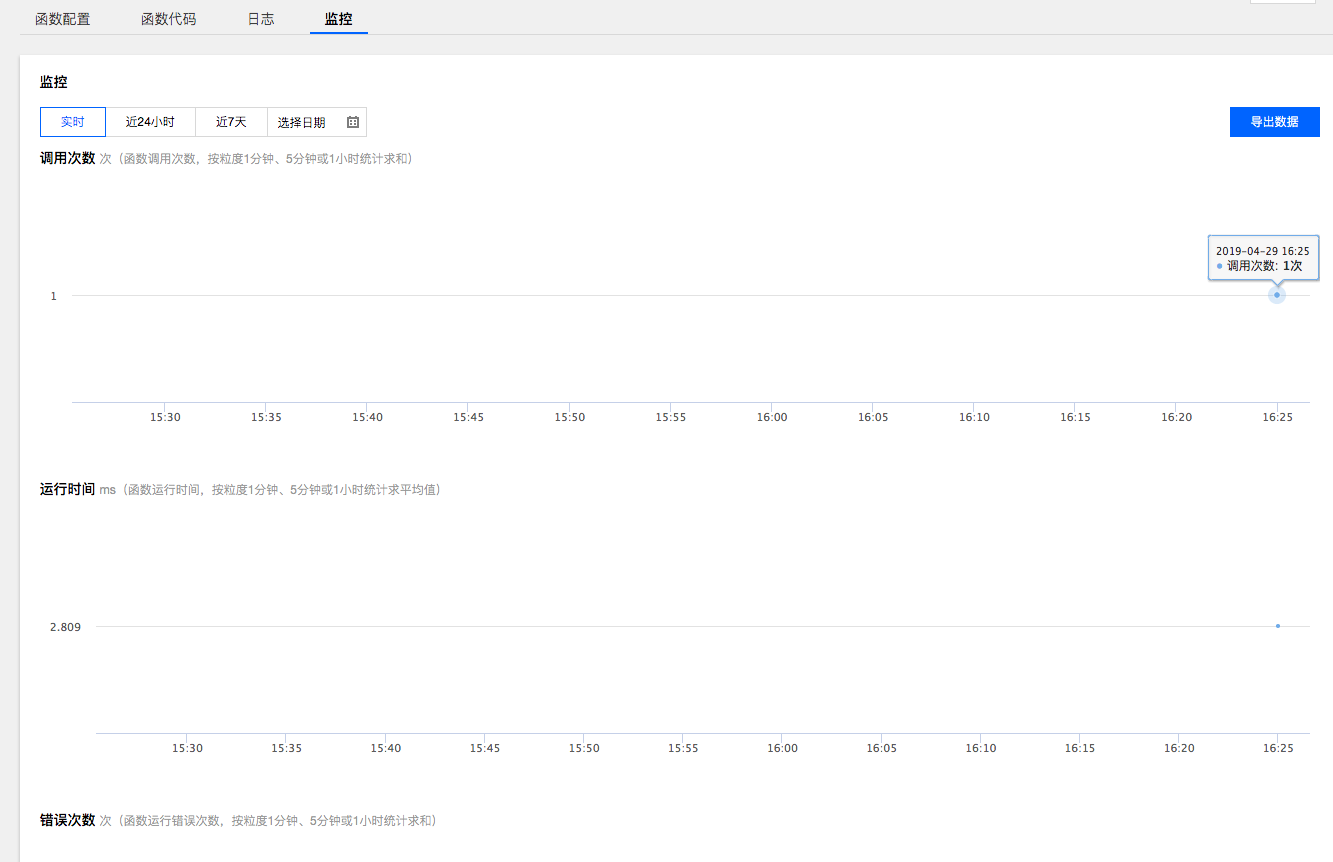
Monitoring Features
- Multiple Time Dimensions: Support viewing monitoring data for different time ranges.
- Graphical Display: Intuitive charts display the trends of various metrics.
- Data Export: Support exporting monitoring data for offline analysis.
- Real-time Updates: Monitoring data is updated in real time, reflecting the latest status.
WeChat Developer Tools Monitoring
View cloud function monitoring data in the WeChat Developer Tools:
- Open the WeChat Developer Tools
- Go to the TCB console
- Select the corresponding cloud function
- Click "Monitoring" to view various metrics.
