Service Invocation Log
📋 Overview
When using Cloud Development resources (HTTP access service, Cloud Functions, databases, Cloud Storage), corresponding service invocation logs are automatically generated for developers to search and analyze in the Cloud Development console. With service invocation logs, you can:
- 🔍 Trace Request Chains - Completely records full-link information of service invocations.
- 📊 Performance Analysis - Monitor response times and performance metrics of various services
- 🐛 Troubleshooting - Quickly locate errors and exception issues
- 📈 Business Insights - Analyzing user behavior and system usage
📝 Log Information
When accessing Cloud Development resources via SDK or HTTP access service, a service invocation log is generated. Each service invocation log contains the following core information:
| Information Category | Description | Purpose |
|---|---|---|
| 📊 Log Metadata | traceId, spanId, childOf | Trace tracing and correlation analysis |
| 🎯 Invoked Service & Event | service, event | Identifying service types and operation types |
| 🗂️ Resource Information | function, file_path, etc. | Locating specifically accessed resources |
| 👤 Caller Information | invoker, source, ua, ip | Identifying request sources and users |
| ⏰ Time Information | startTime, timeCost | Performance analysis and time-series tracing |
| ❌ Error Information | errorCode, errorMsg | Problem diagnosis and error analysis |
📊 Log Metadata
Log Metadata is core to distributed tracing and includes the following fields:
| Field | Description | Example Value |
|---|---|---|
| traceId | Full trace unique identifier | 8f431b7e-bfcc-423e-99d8-cda72471ff49 |
| spanId | Unique identifier for the current invocation | bbe75687-fffb-6cb8 |
| childOf | spanId of the parent invocation | abc12345-defg-6789 |
🔗 Link Tracing Fundamentals
During a complete service invocation, multiple Cloud Development resources may be accessed, resulting in multiple service invocation logs:
- 🆔 Same traceId: All logs for the same request share the same traceId
- 🏷️ Different spanId: Each service invocation has a unique spanId
- 🔗 childOf Relationship: Records the parent-child invocation relationship to construct the full call chain
Scenario: Invoke Cloud Function A via the SDK, and Cloud Function A calls Cloud Function B
SDK --> Cloud Function A --> Cloud Function B
Logging:
- Log A:
traceId: abc123,spanId: span001,childOf: null - Log B:
traceId: abc123,spanId: span002,childOf: span001
By using traceId, you can query the complete call chain; by using childOf, you can reconstruct the invocation relationship.
🎯 Invoke Service & Event
In logs, service and event are used to tag the service type and specific operation of each service invocation:
| Service Type | Service Value | Event Action | Description |
|---|---|---|---|
| 🔧 Cloud Function | function | callFunction | Function call execution |
| 📁 Cloud Storage | storage | upload, delete, download, getTempFileURL | File operations |
| 🗄️ Database | database | add, remove, update, get, count, aggregate | CRUD and aggregation operations |
| 🌐 Cloud Hosting | app | GET, POST, PUT, DELETE, PATCH | HTTP request methods |
📋 Common Event Type Details
Cloud Storage Events:
upload- File uploaddelete- Delete filesdownload- File downloadgetTempFileURL- Obtain temporary access URL
Database Events:
add- Add recordremove- Delete recordupdate- Update recordget- Query recordcount- Count quantityaggregate- Aggregate query
Cloud Hosting Events:
- HTTP methods correspond to specific API call types
🗂️ Resource Information
Different resource types use different fields to identify the specific resources being accessed:
| Resource Type | Field Name | Data Type | Description | Example |
|---|---|---|---|---|
| 🔧 Cloud Function | function | String | Function name | "login", "sendEmail" |
| 📁 Cloud Storage | file_path | Array | File path list | ["/images/avatar.jpg"] |
| 🗄️ Database | collectionName | Array | Collection name list | ["users", "orders"] |
| 🌐 HTTP Service | httpPath | String | Request path (excluding query parameters) | "/api/user/profile" |
📝 Field Description
file_path Array Format:
- Single-file operation:
["/path/to/file.jpg"] - Batch operation:
["/file1.jpg", "/file2.png", "/file3.pdf"] - Batch retrieval of temporary access URLs includes multiple file paths.
collectionName Array Format:
- Single-table operation:
["users"] - Aggregate query:
["users", "orders", "products"] - Cross-collection operations involve multiple collection names.
httpPath Format:
- Original request:
GET /api/user/profile?id=123&type=full - Recorded path:
"/api/user/profile"(query parameters automatically removed)
👤 Caller Information
Service invocation logs record the source information of requests in detail, facilitating security auditing and troubleshooting:
| Field Name | Description | Possible Values | Purpose |
|---|---|---|---|
| invoker | Caller Identity | admin, uid:user123, anonymous | User identity recognition |
| source | Request source channel | web-sdk, node-sdk, http, schedule | Source channel analysis |
| ua | Client User-Agent | Browser/SDK version information | Client environment analysis |
| invokerIp | Request source IP address | 192.168.1.100, 10.0.0.1 | Geolocation and security analysis |
🔍 Detailed Field Explanation
invoker Caller Type:
admin- Administrator invocation (Console operations)uid:xxxxx- Authenticated user invocationanonymous- Anonymous user invocation- null - system internal invocation
source Source Channel:
web-sdk- Web client SDK invocationnode-sdk- Node SDK invocationadmin-sdk- Admin console SDK invocationhttp- Direct HTTP API invocationschedule- Scheduled trigger invocationtrigger- Database trigger invocation
ua Information Example:
Mozilla/5.0 (Windows NT 10.0; Win64; x64) AppleWebKit/537.36
CloudBase-JS-SDK/1.5.0
CloudBase-Node-SDK/2.8.1
⏰ Time Information
Time information is used for performance analysis and invocation time-series tracing:
| Field Name | Description | Format | Example |
|---|---|---|---|
| startTime | Service invocation start time | ISO 8601 timestamp | 2023-12-01T10:30:45.123Z |
| timeCost | Invocation duration (milliseconds) | Numeric | 150 (represents 150ms) |
📊 Performance Analysis Application
Through time information, the following can be performed:
- ⚡ Performance Monitoring: Identifying slow queries and performance bottlenecks
- 📈 Trend Analysis: Statistics on changes in average response time
- 🚨 Anomaly Detection: Discover requests with abnormal response times
- 🎯 Optimization Guidance: Providing data support for performance optimization
❌ Error Information
Error messages help to quickly locate and diagnose issues:
| Field Name | Description | Example |
|---|---|---|
| errorCode | Standard error code | INVALID_PARAM, PERMISSION_DENIED |
| errorMsg | Detailed error description | "The parameter userId cannot be empty", "Database connection timed out" |
🔧 Common Error Codes
| Error Code | Description | Solution |
|---|---|---|
INVALID_PARAM | Invalid parameters | Check the request parameter format and required fields |
PERMISSION_DENIED | Permission denied | Check user permissions and security rules |
RESOURCE_NOT_FOUND | Resource not found | Verify the resource path and name are correct |
QUOTA_EXCEEDED | Quota exceeded | Check resource usage and quota limits |
NETWORK_ERROR | Network error | Check the network connection and service status |
🎯 Typical Use Cases
🔍 Scenario 1: Troubleshooting User Access Errors
For details on log search methods, please refer to Log Search.
If User A encounters an error when accessing CloudBase resources, how to troubleshoot the error?
- Use invoker:A and errorCode:* to search for this user's latest failed service call logs.
- After retrieving the service invocation logs, locate the log's traceId based on the access time. By using traceId:{traceId}, search all service invocation logs for this specific call, then analyze the error cause based on call details, resource information, and error messages in the logs.
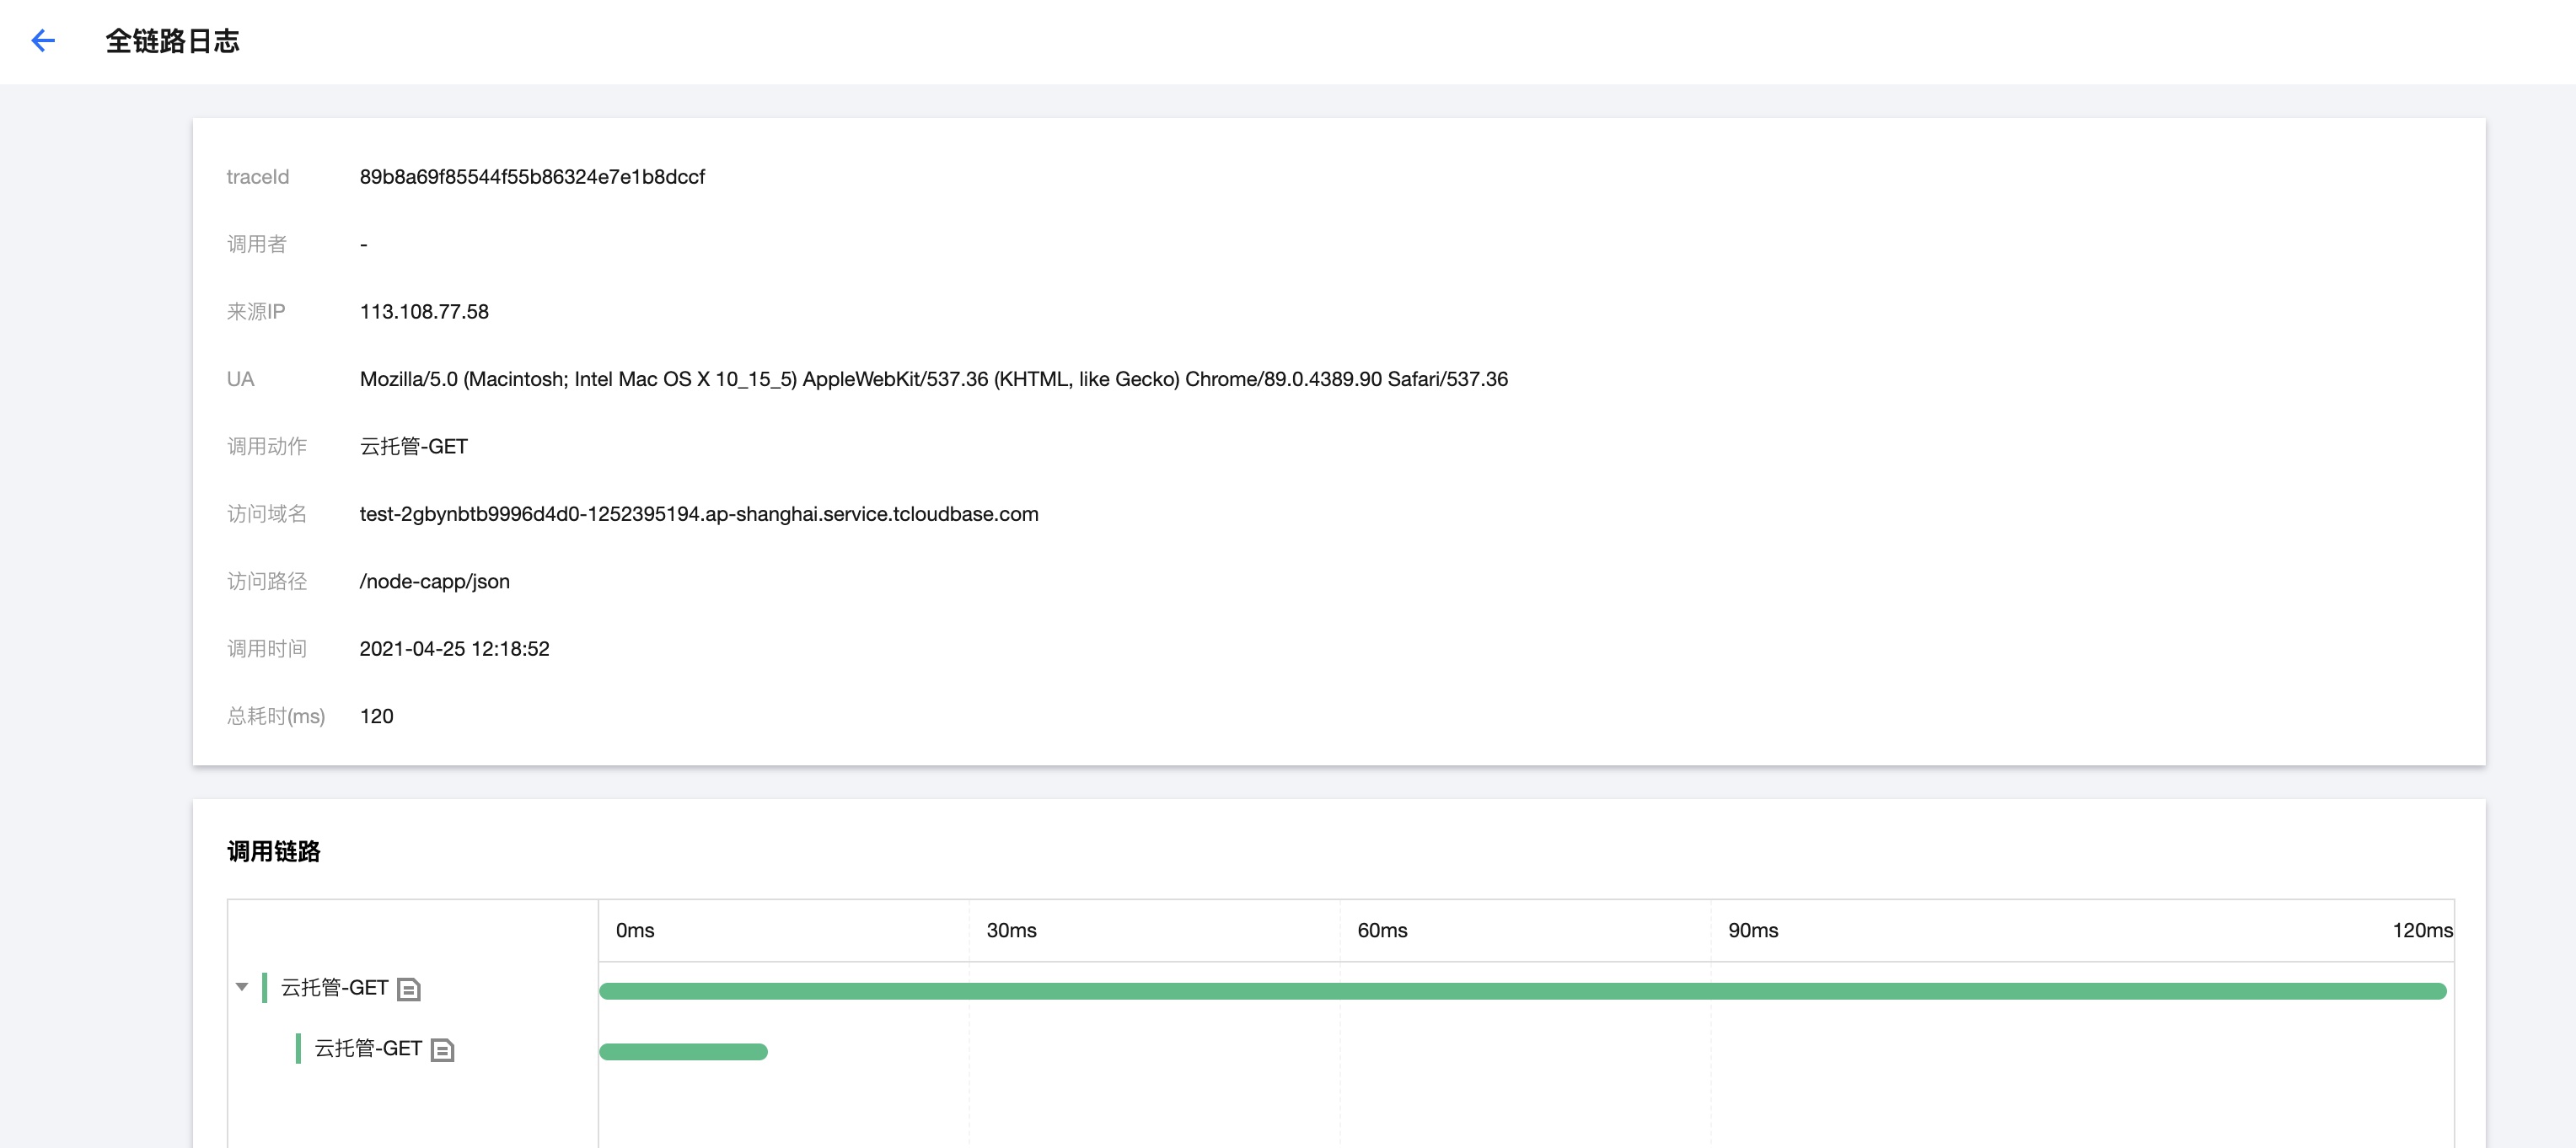
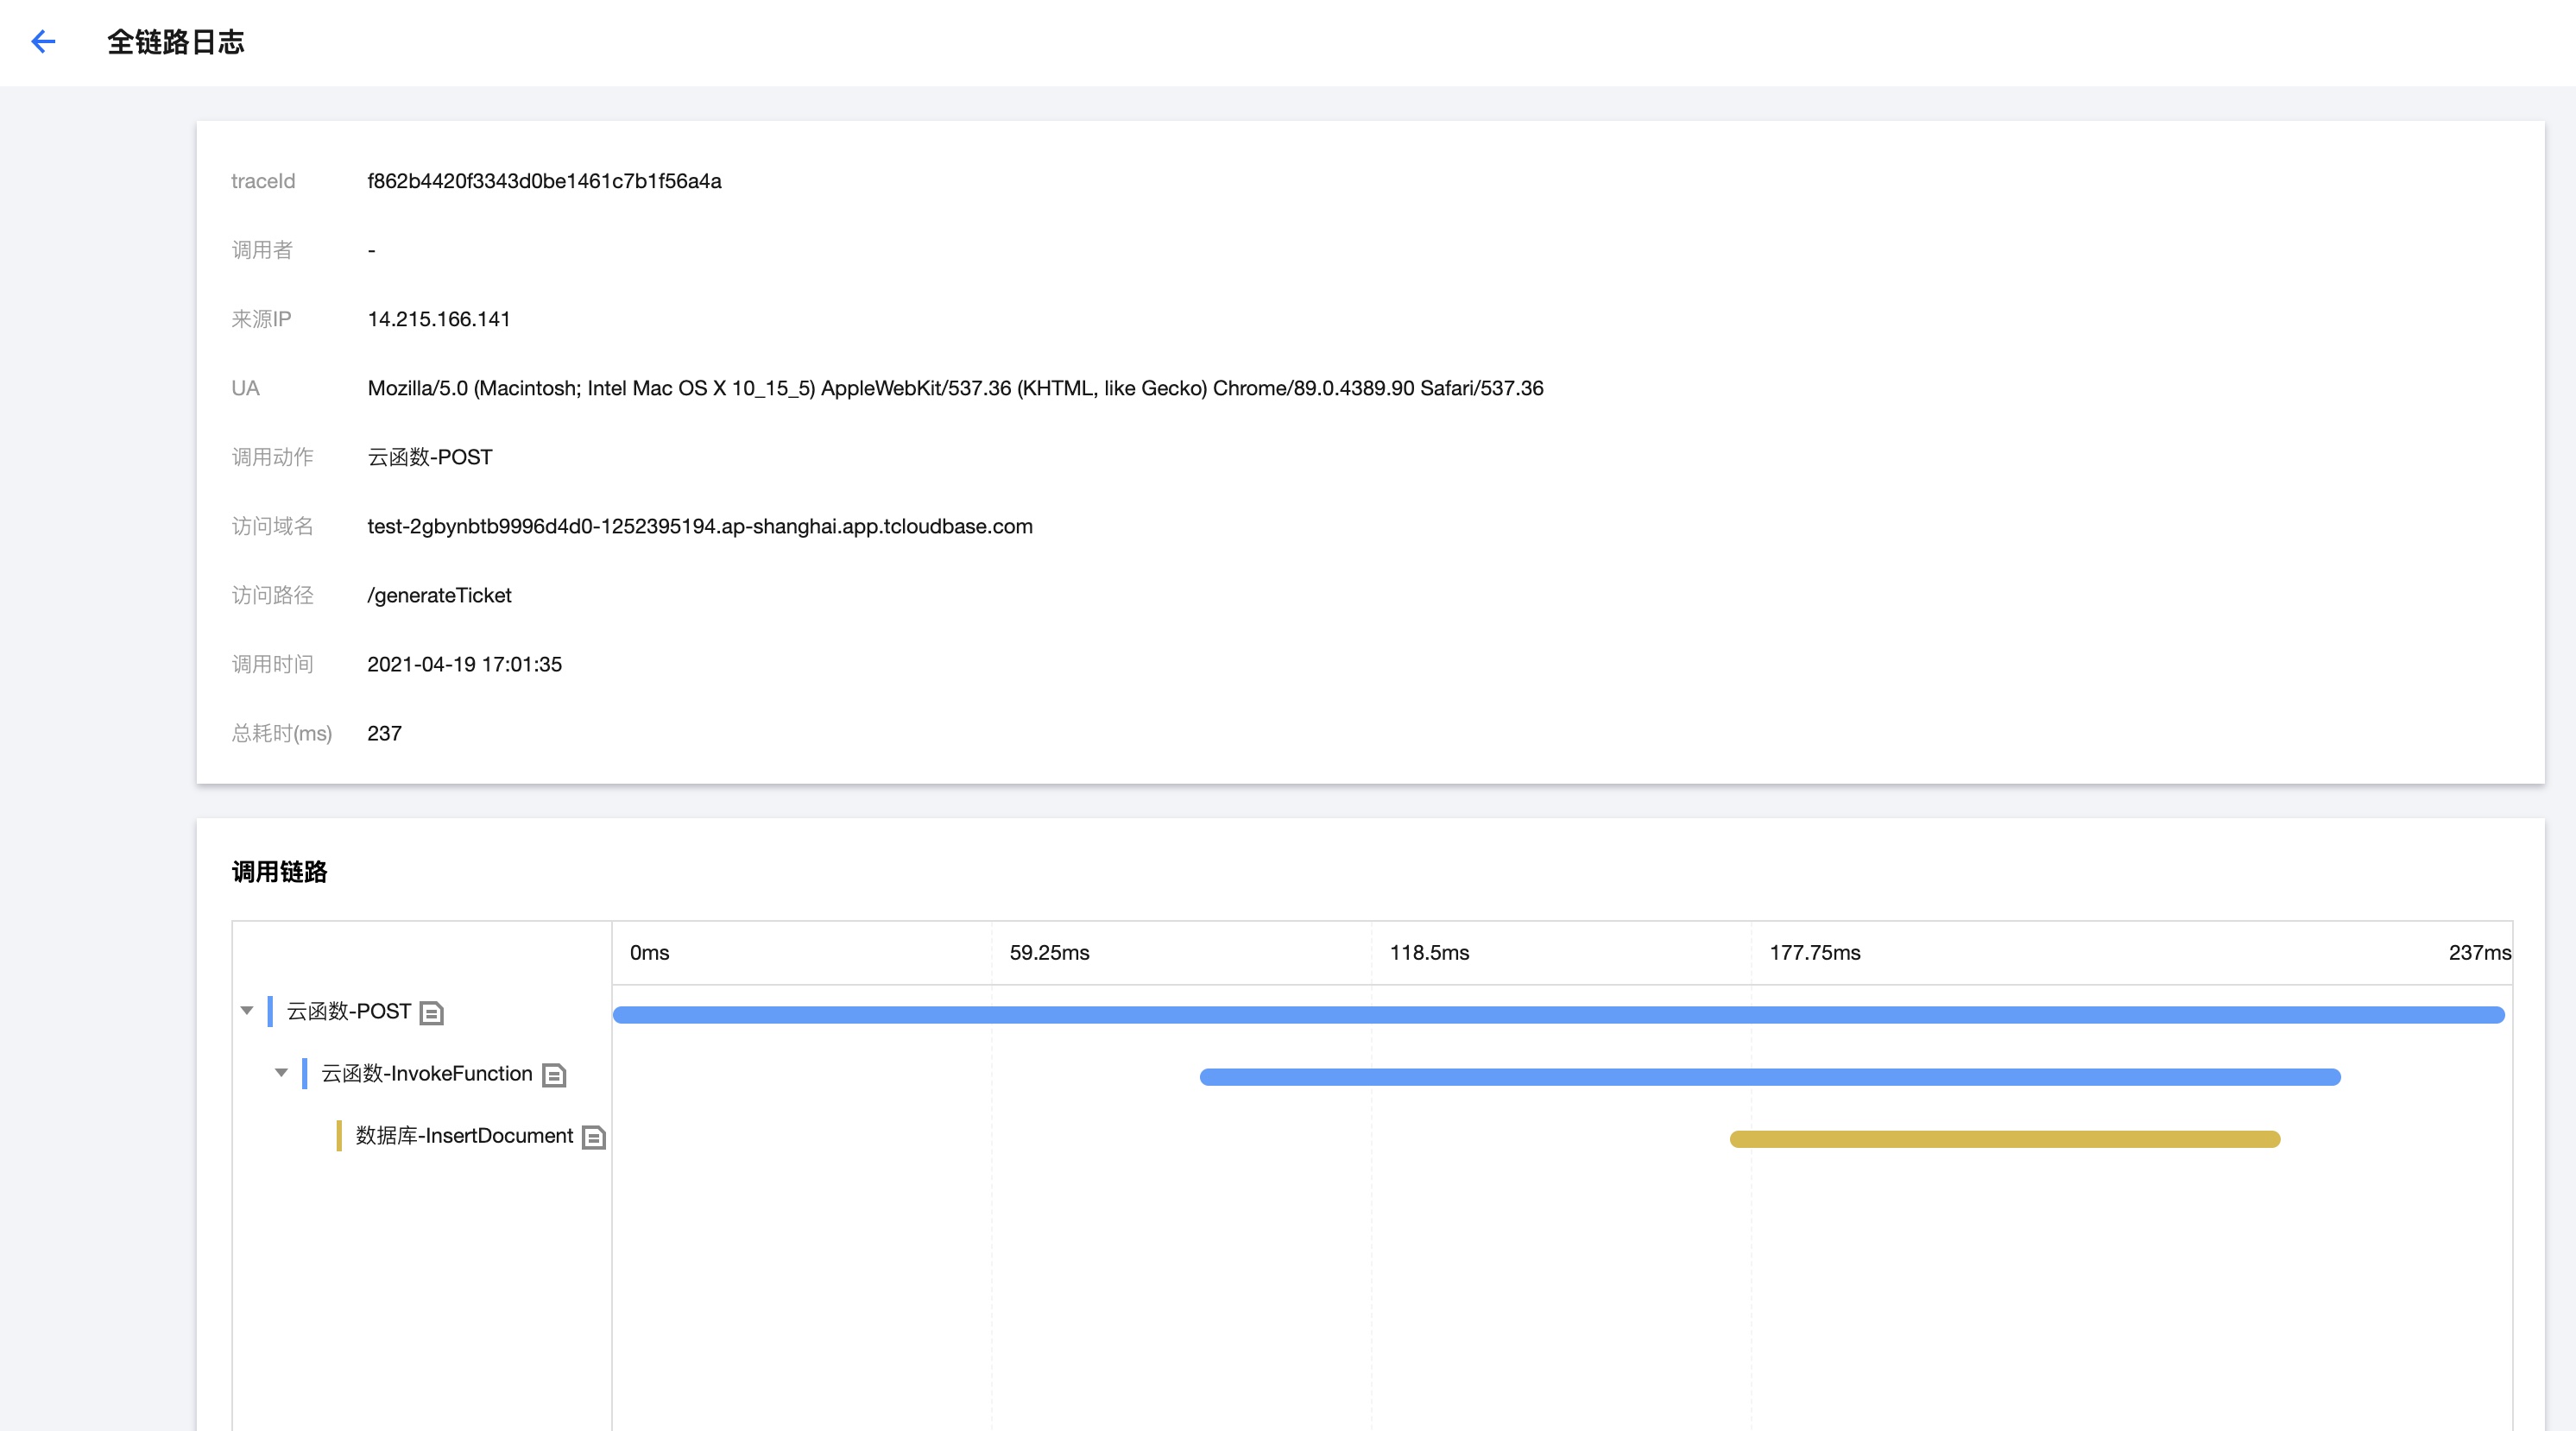
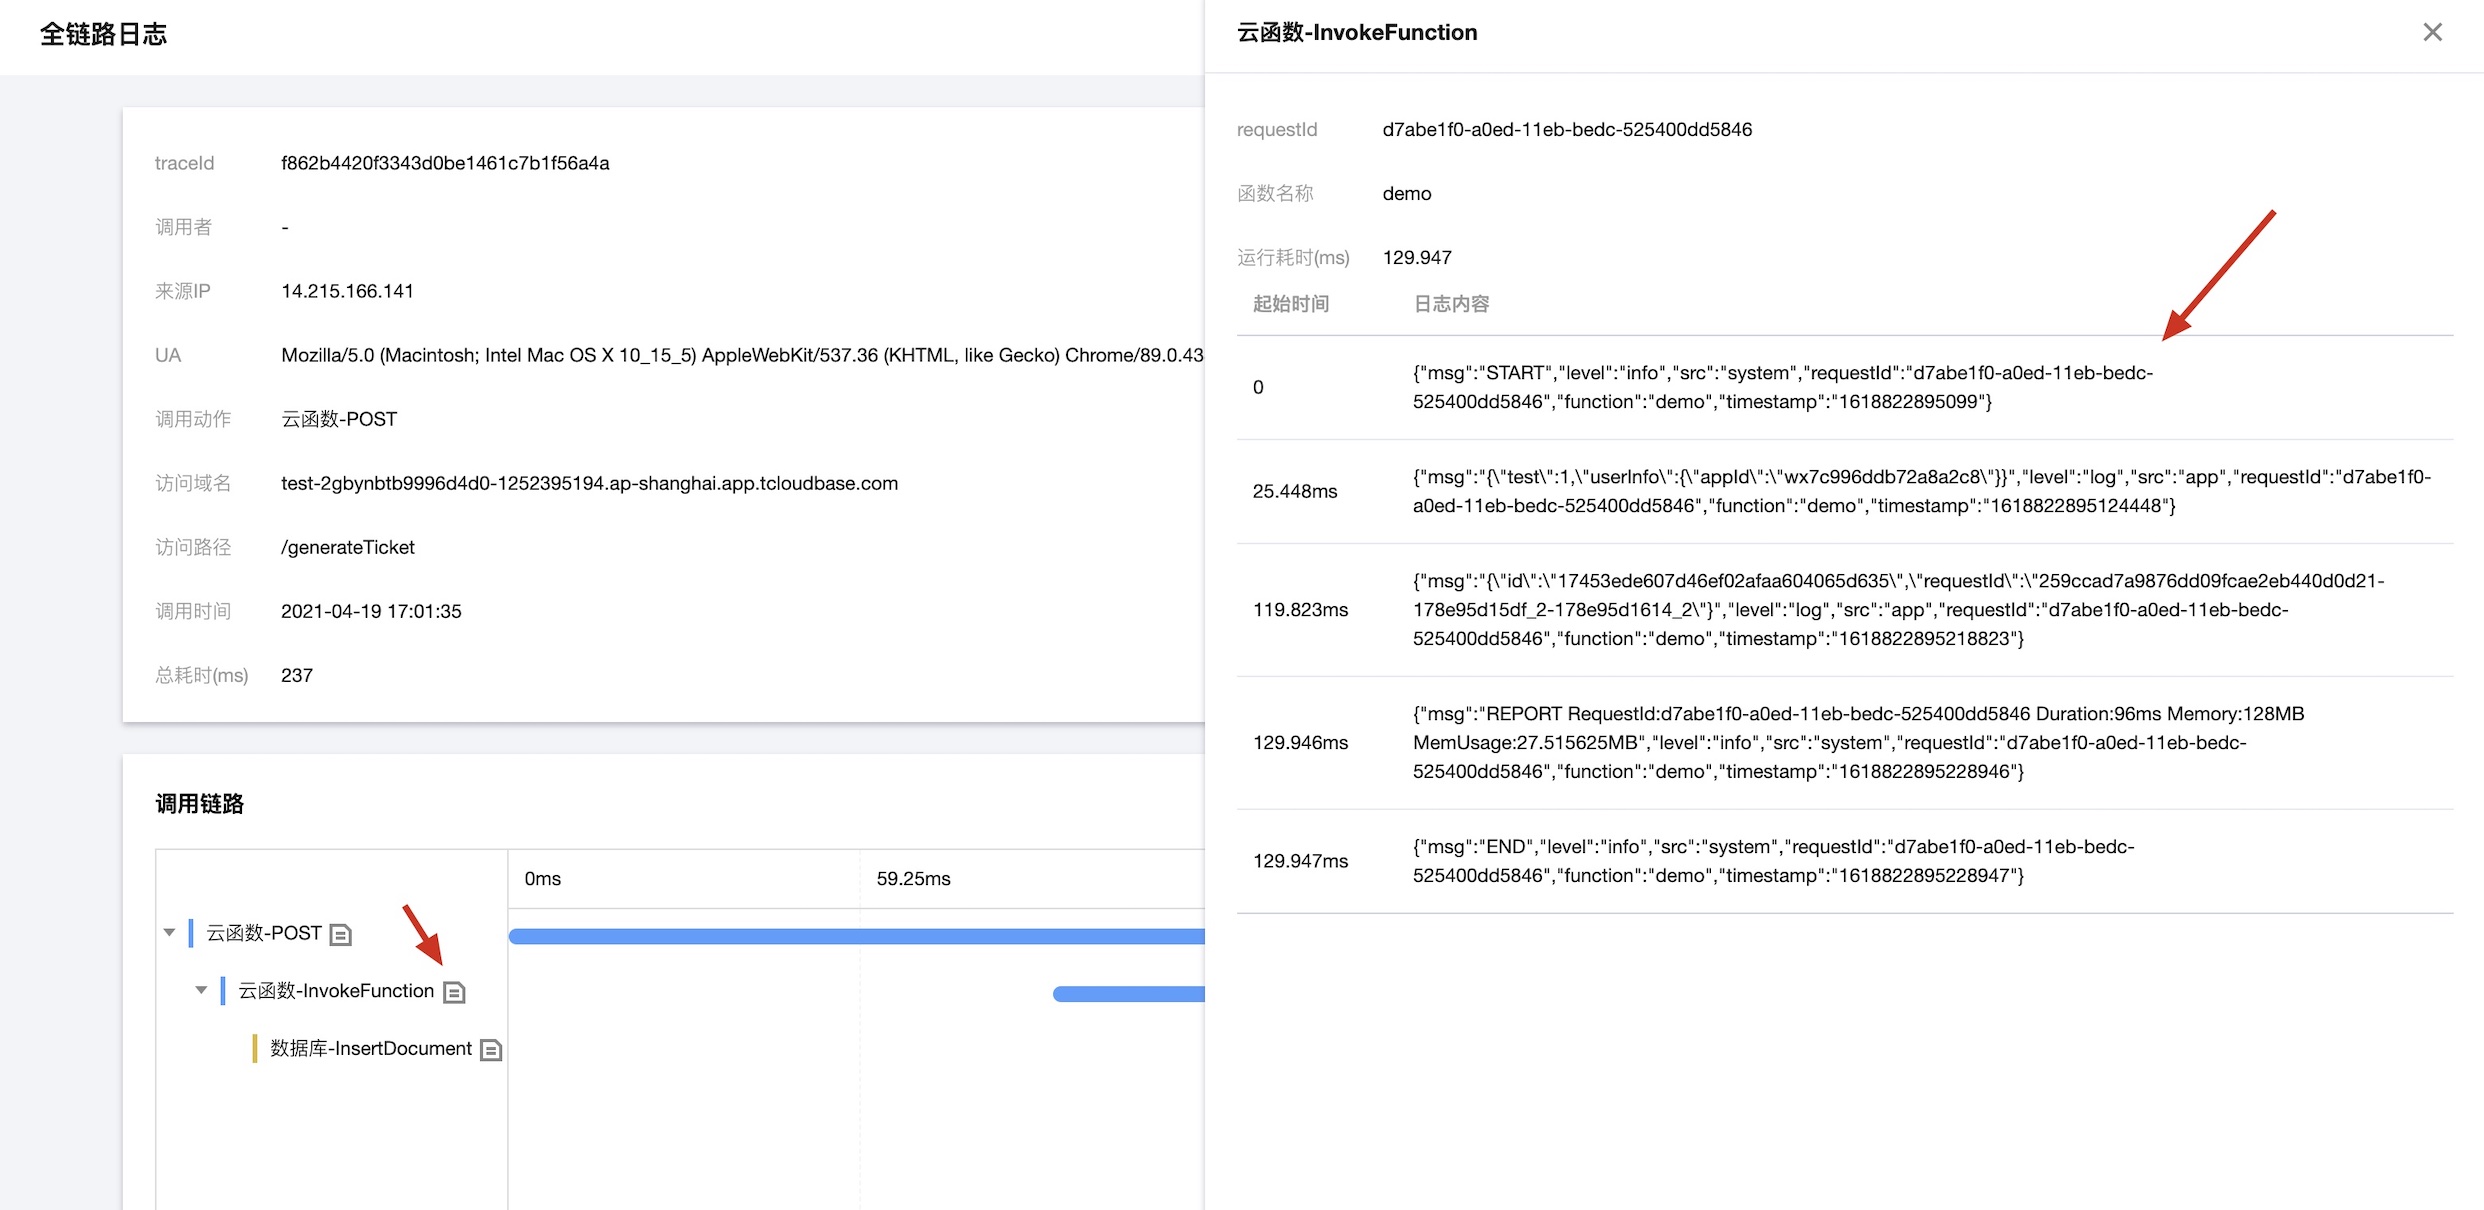
- Click the "Full Link Logs" button to navigate to the full link logs page and view the call chain relationships. On the call details page, you can click to view logs during function execution.
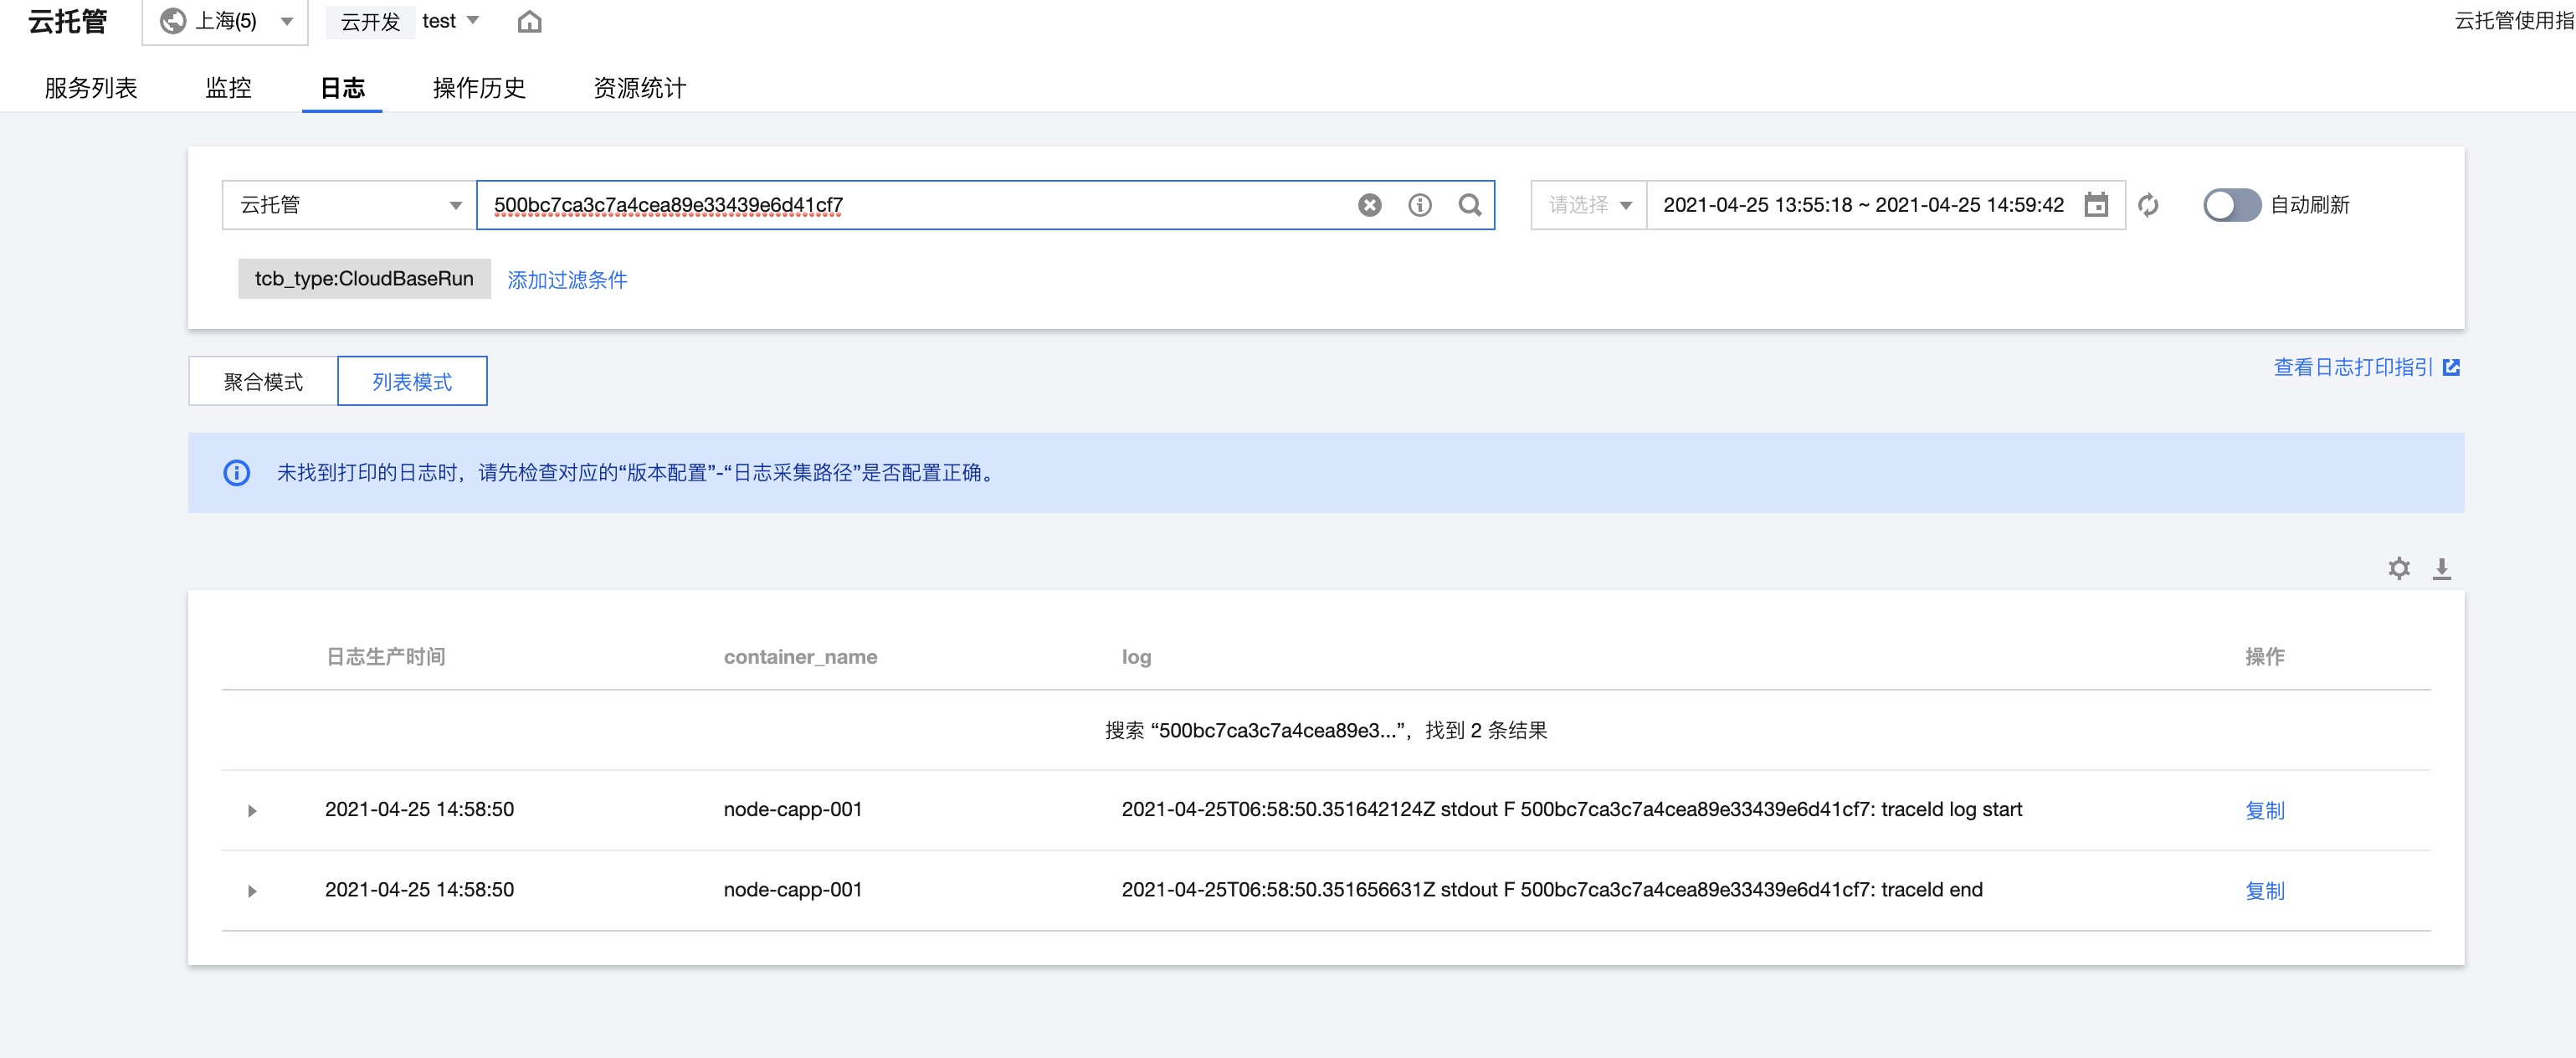
🌐 Scenario 2: Cloud Hosting Service Invocation Scenario
When A user invokes interface 1 of Cloud Run Service A, and interface 1 subsequently calls interface 2 of the same Cloud Run Service A, modifications to the business logic are required to associate both requests with the same traceid.
- Within the
/jsonendpoint, call the/traceinterface and propagate thex-cloudbase-tracefield from the request headers. - In the
/traceinterface, parse thex-cloudbase-traceto obtain thetraceId, output it in the logs, and use it for subsequent log searches.
Taking Node.js koa framework code as an example, within the /json interface of Cloud Run Service A, another /trace interface is invoked.
router.get("/json", async (ctx, next) => {
  const res = await axios.get(
    "https://test-2gbynbtb9996d4d0-1252395194.ap-shanghai.<your-env-region>.app.tcloudbase.com/node-capp/trace",
    {
      headers: {
        "x-cloudbase-trace": ctx.req.headers["x-cloudbase-trace"]
      }
    }
  );

  ctx.body = res.data;
});
router.get("/trace", async (ctx, next) => {
  // Convert from base64 to utf8 encoding. The data format is ${traceId},${spanId},${on | off}
  // Example: OGY0MzFiN2ViZmNjNDIzZTk5ZDhjZGE3MjQ3MWZmNDksYmJlNzU2ODdmZmZiNmNiOCxvbg decodes to 8f431b7ebfcc423e99d8cda72471ff49,bbe75687fffb6cb8,on
  const traceStr = Buffer.from(ctx.req.headers["x-cloudbase-trace"], "base64").toString("utf-8");

  const [traceId] = traceStr.split(",");
  // After decoding, this field can be printed in the logs to facilitate log correlation.
  console.log(`${traceId}: traceId log start`);
  ctx.body = {
    traceStr,
    traceId
  };
  console.log(`${traceId}: traceId end`);
});
Note: If a Cloud Function invokes a Cloud Run service, the x-cloudbase-trace field is propagated from the TCB_TRACELOG environment variable in the Cloud Function.