Data Dashboard
Introduction
The data dashboard is a system application on the cloud platform that supports configuring statistical conditions or writing query statements to generate various types of statistical charts; and supports grouping and displaying charts to build personalized data dashboards. This tool is designed to make your business analysis and commercial decisions simpler and more efficient.
Feature Introduction
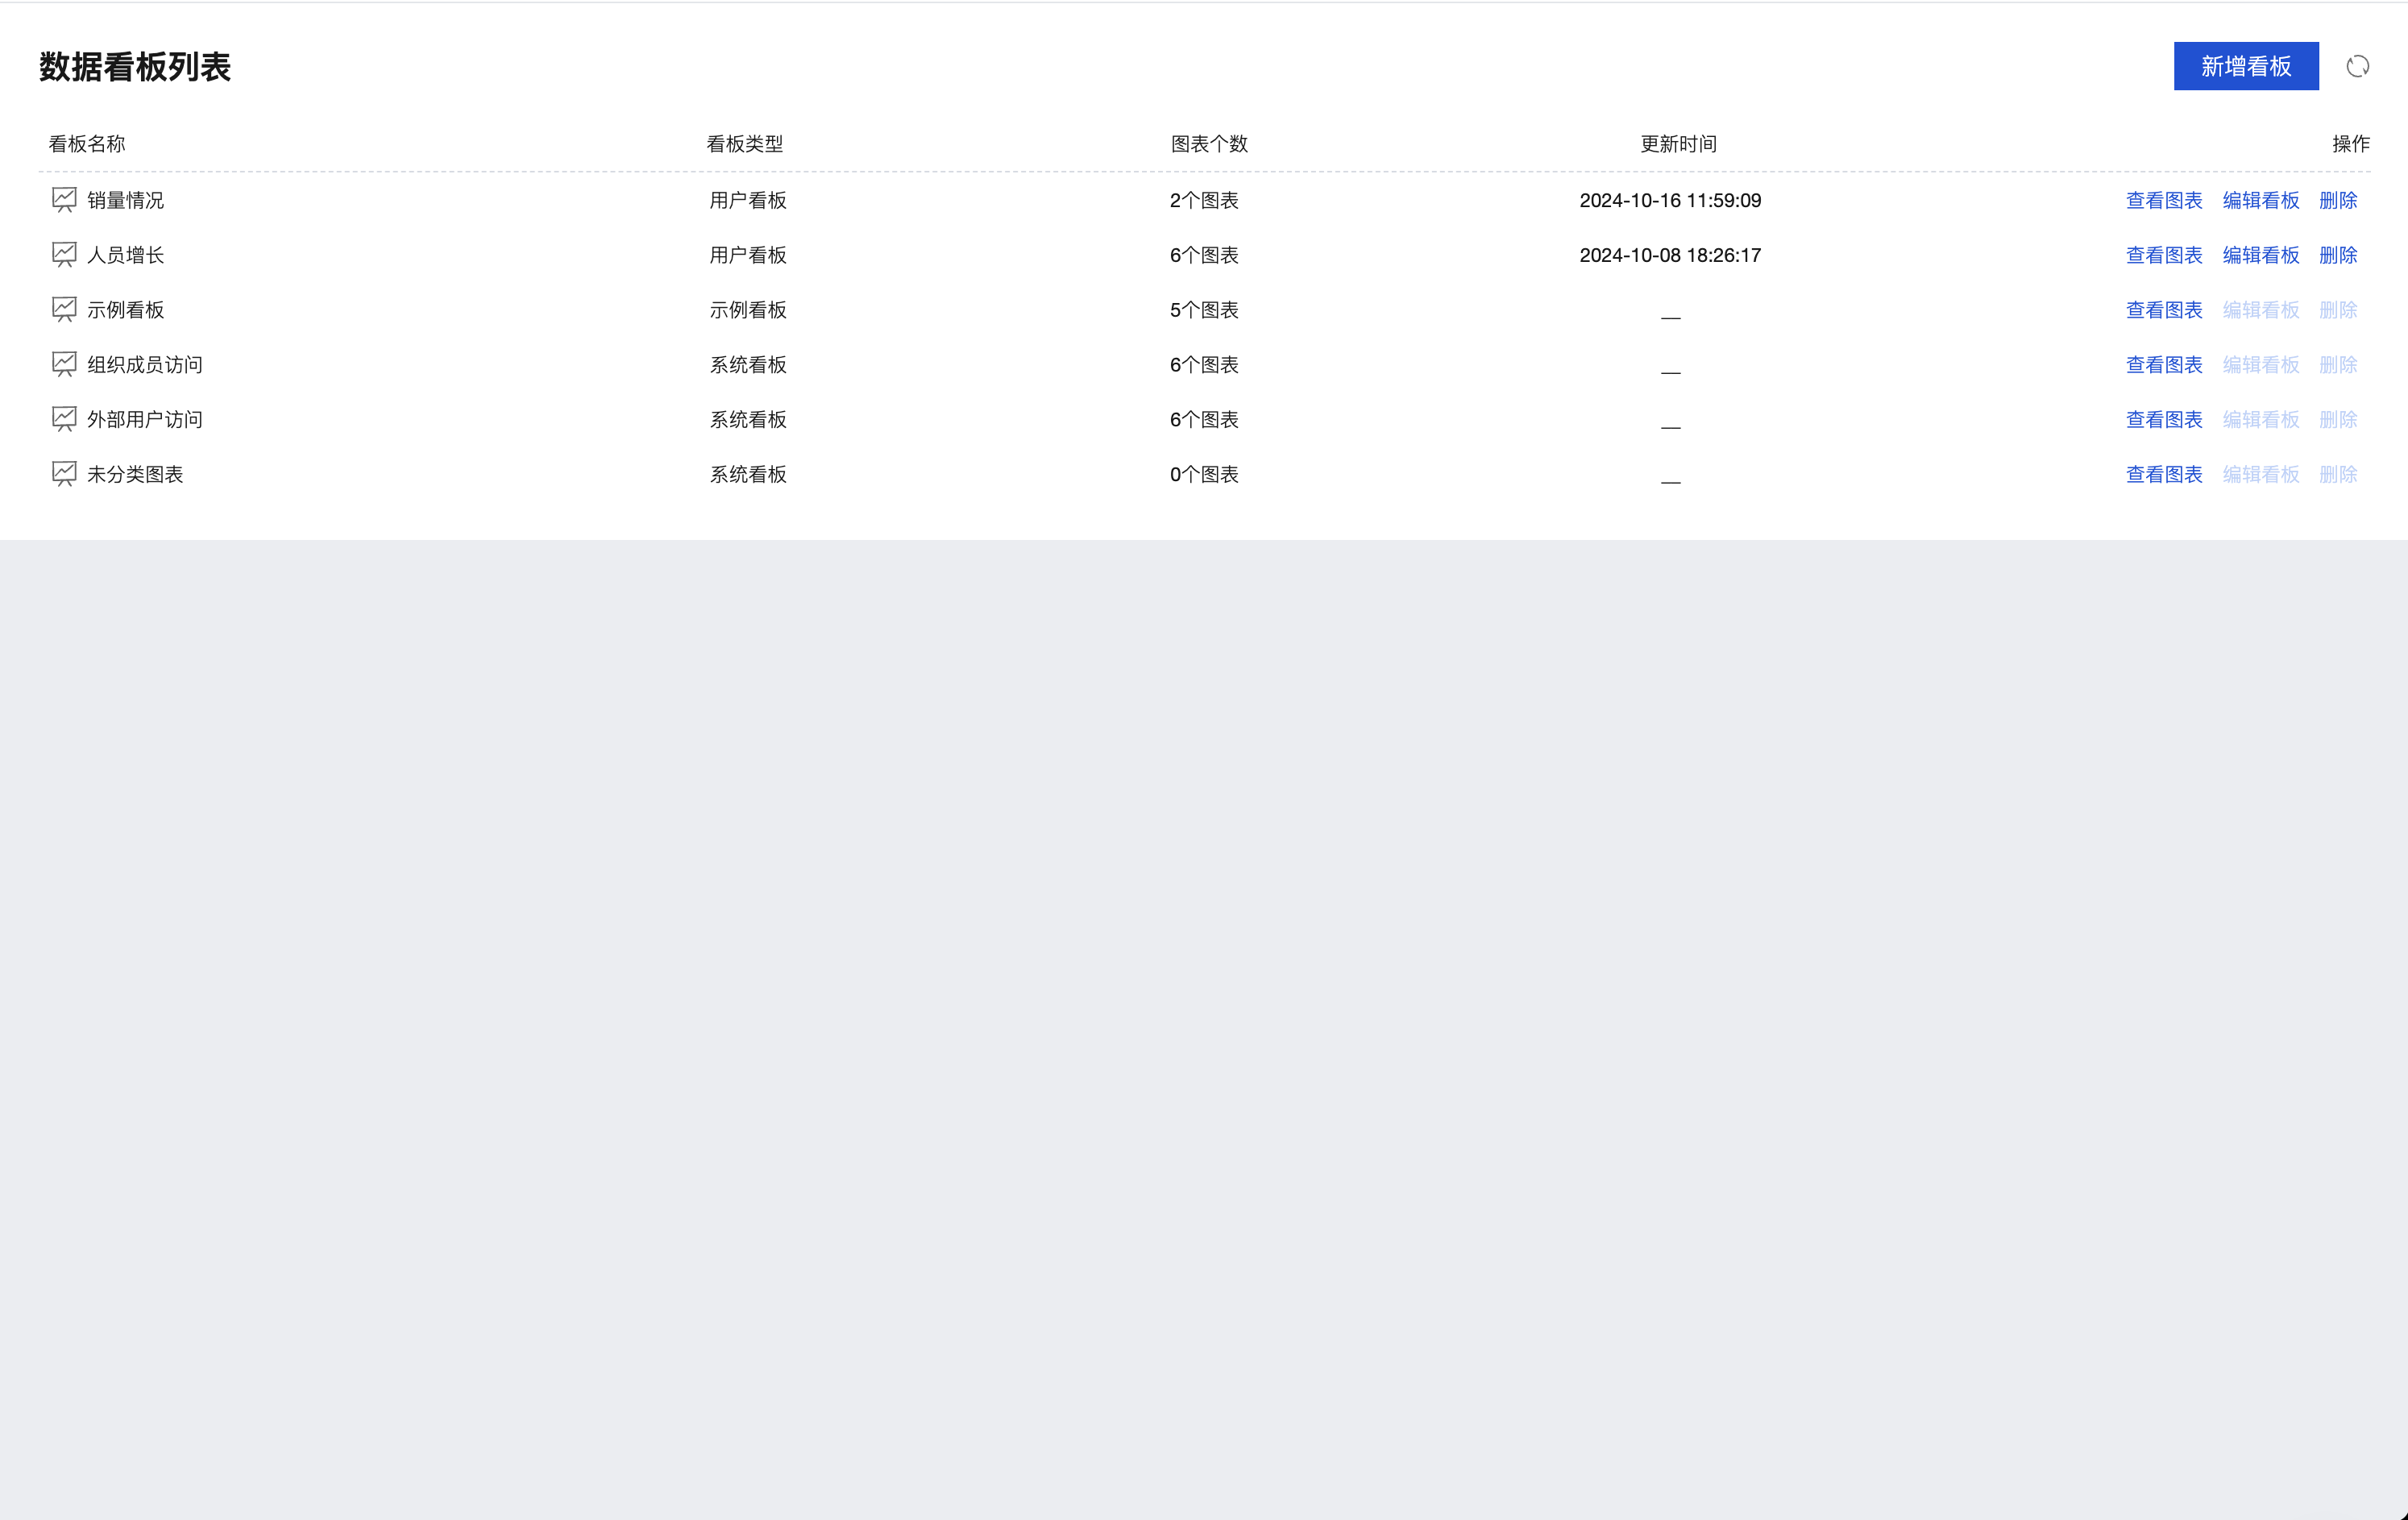
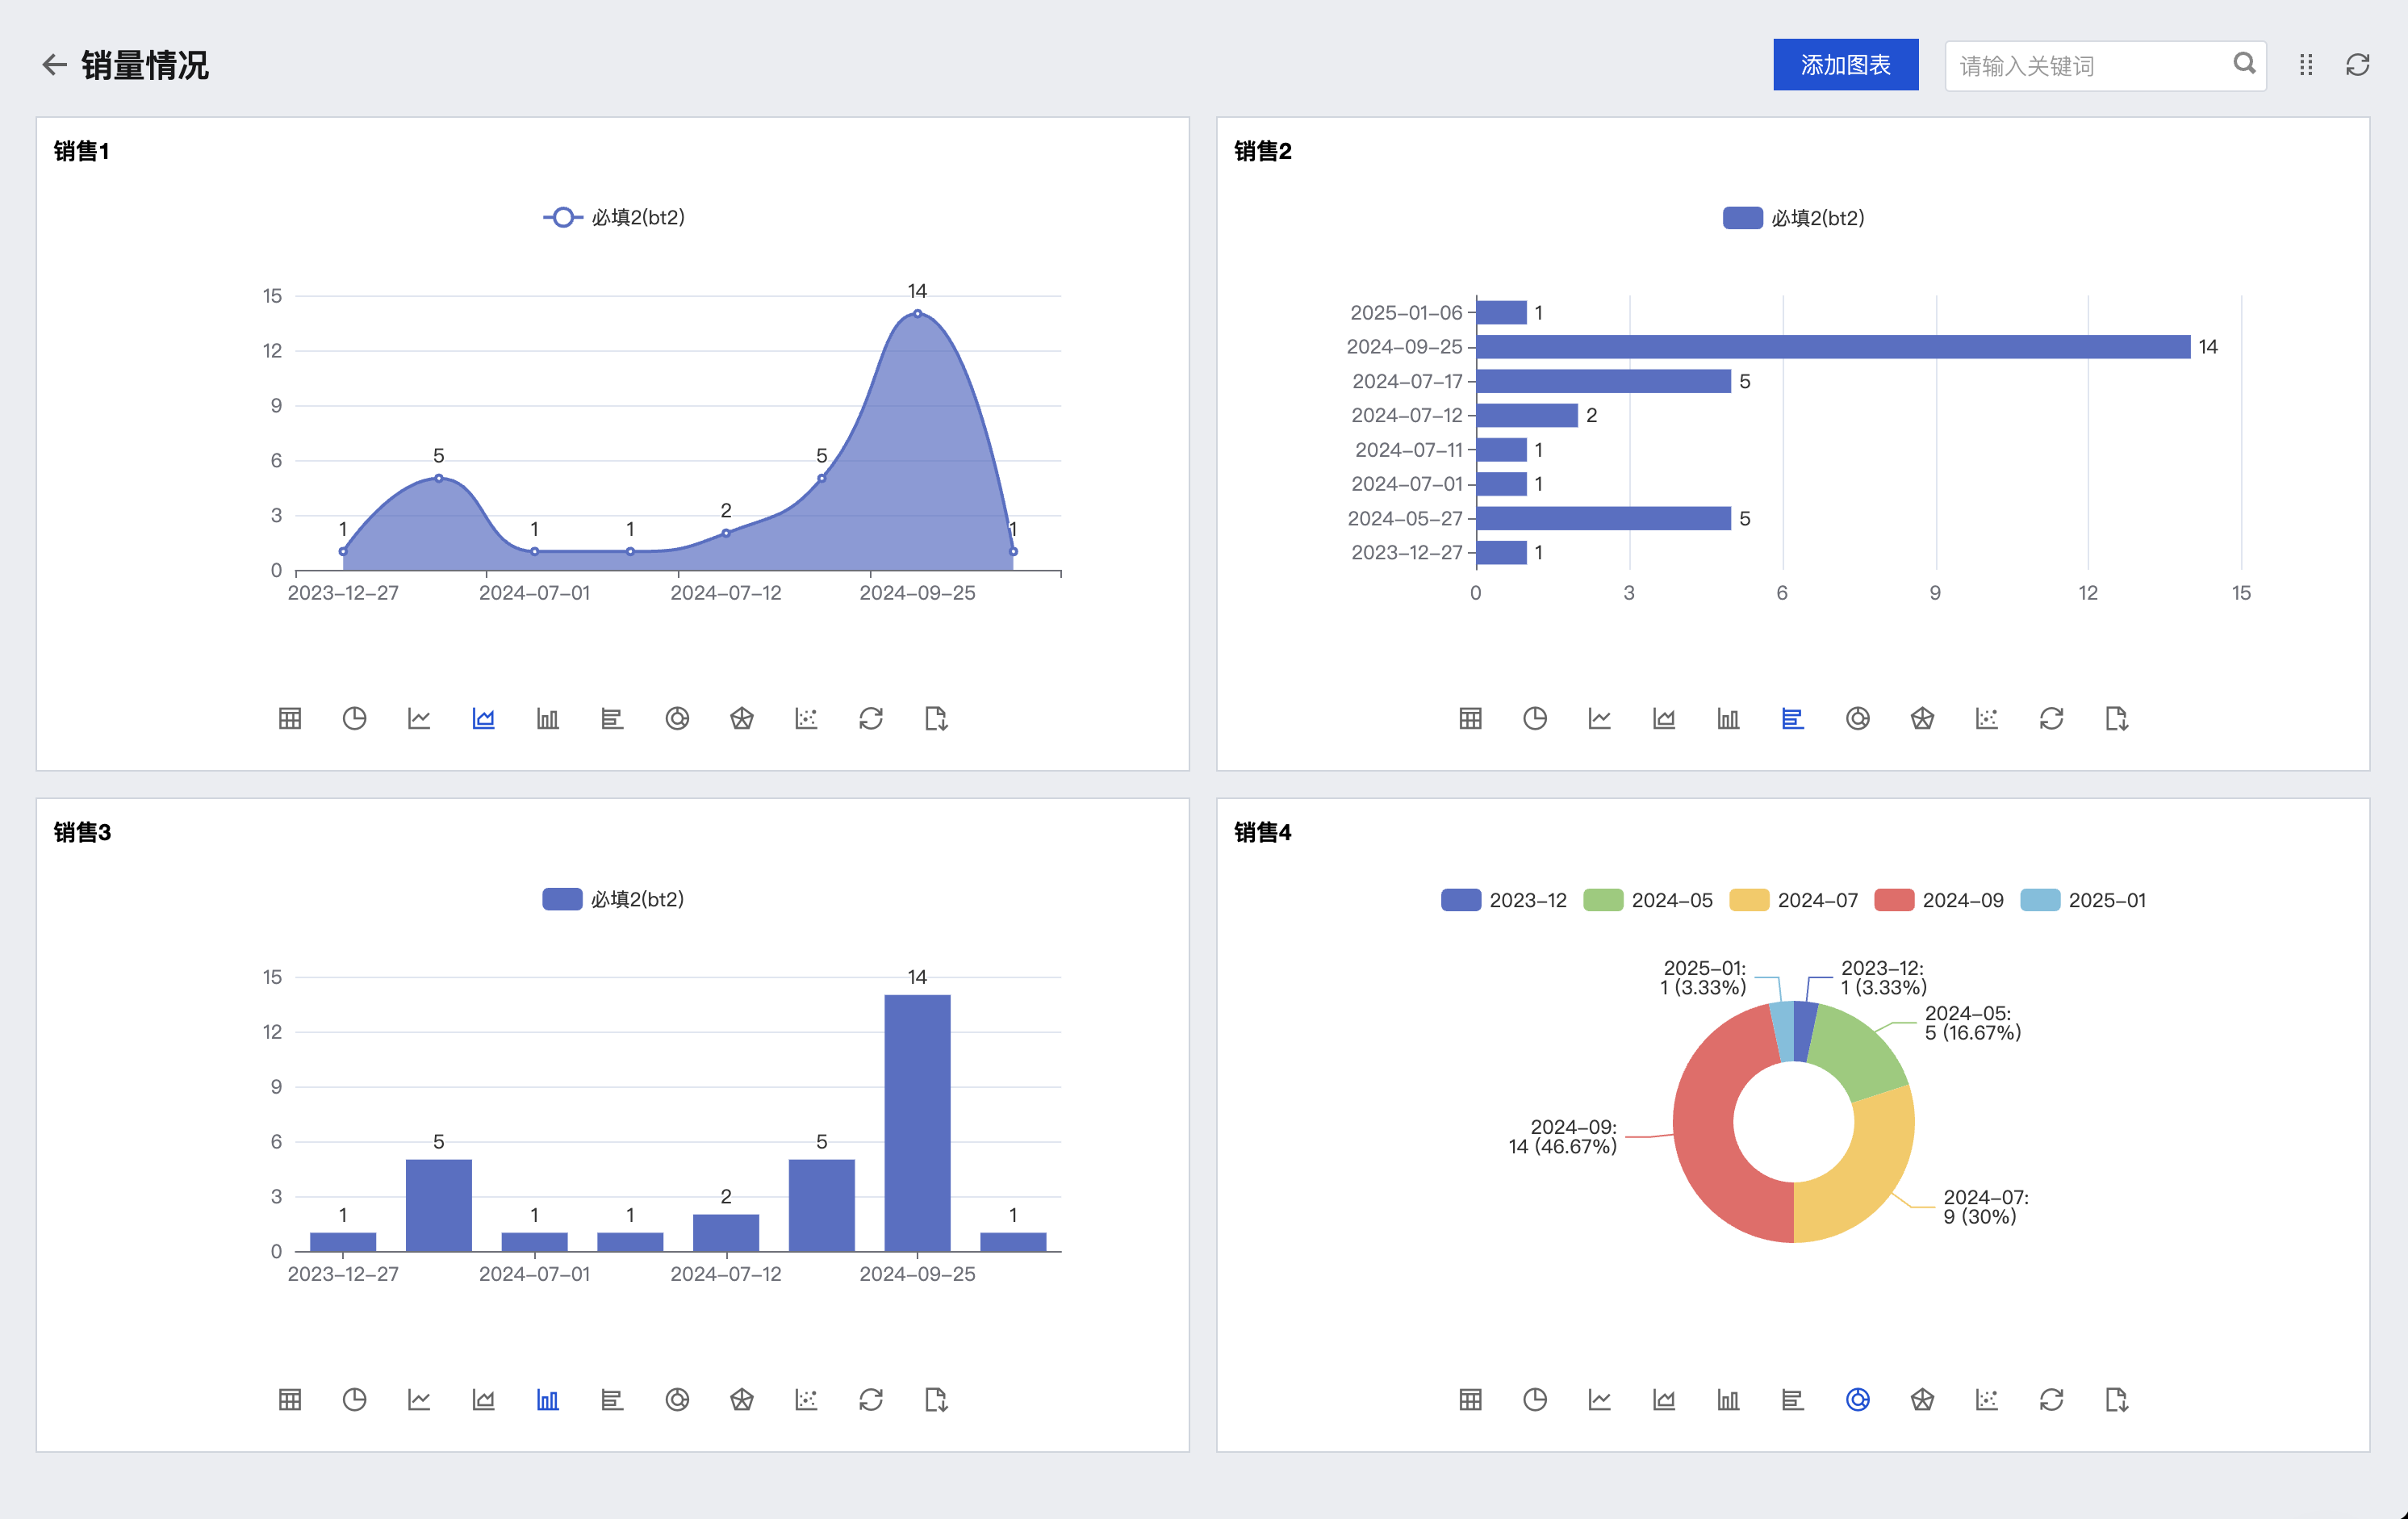
Kanban Management
It provides Kanban management for displaying statistical reports and supports adding custom Kanban groups. By connecting to the database, it can aggregate and display various types of charts such as bar charts, line charts, and pie charts for data in the cloud development environment.
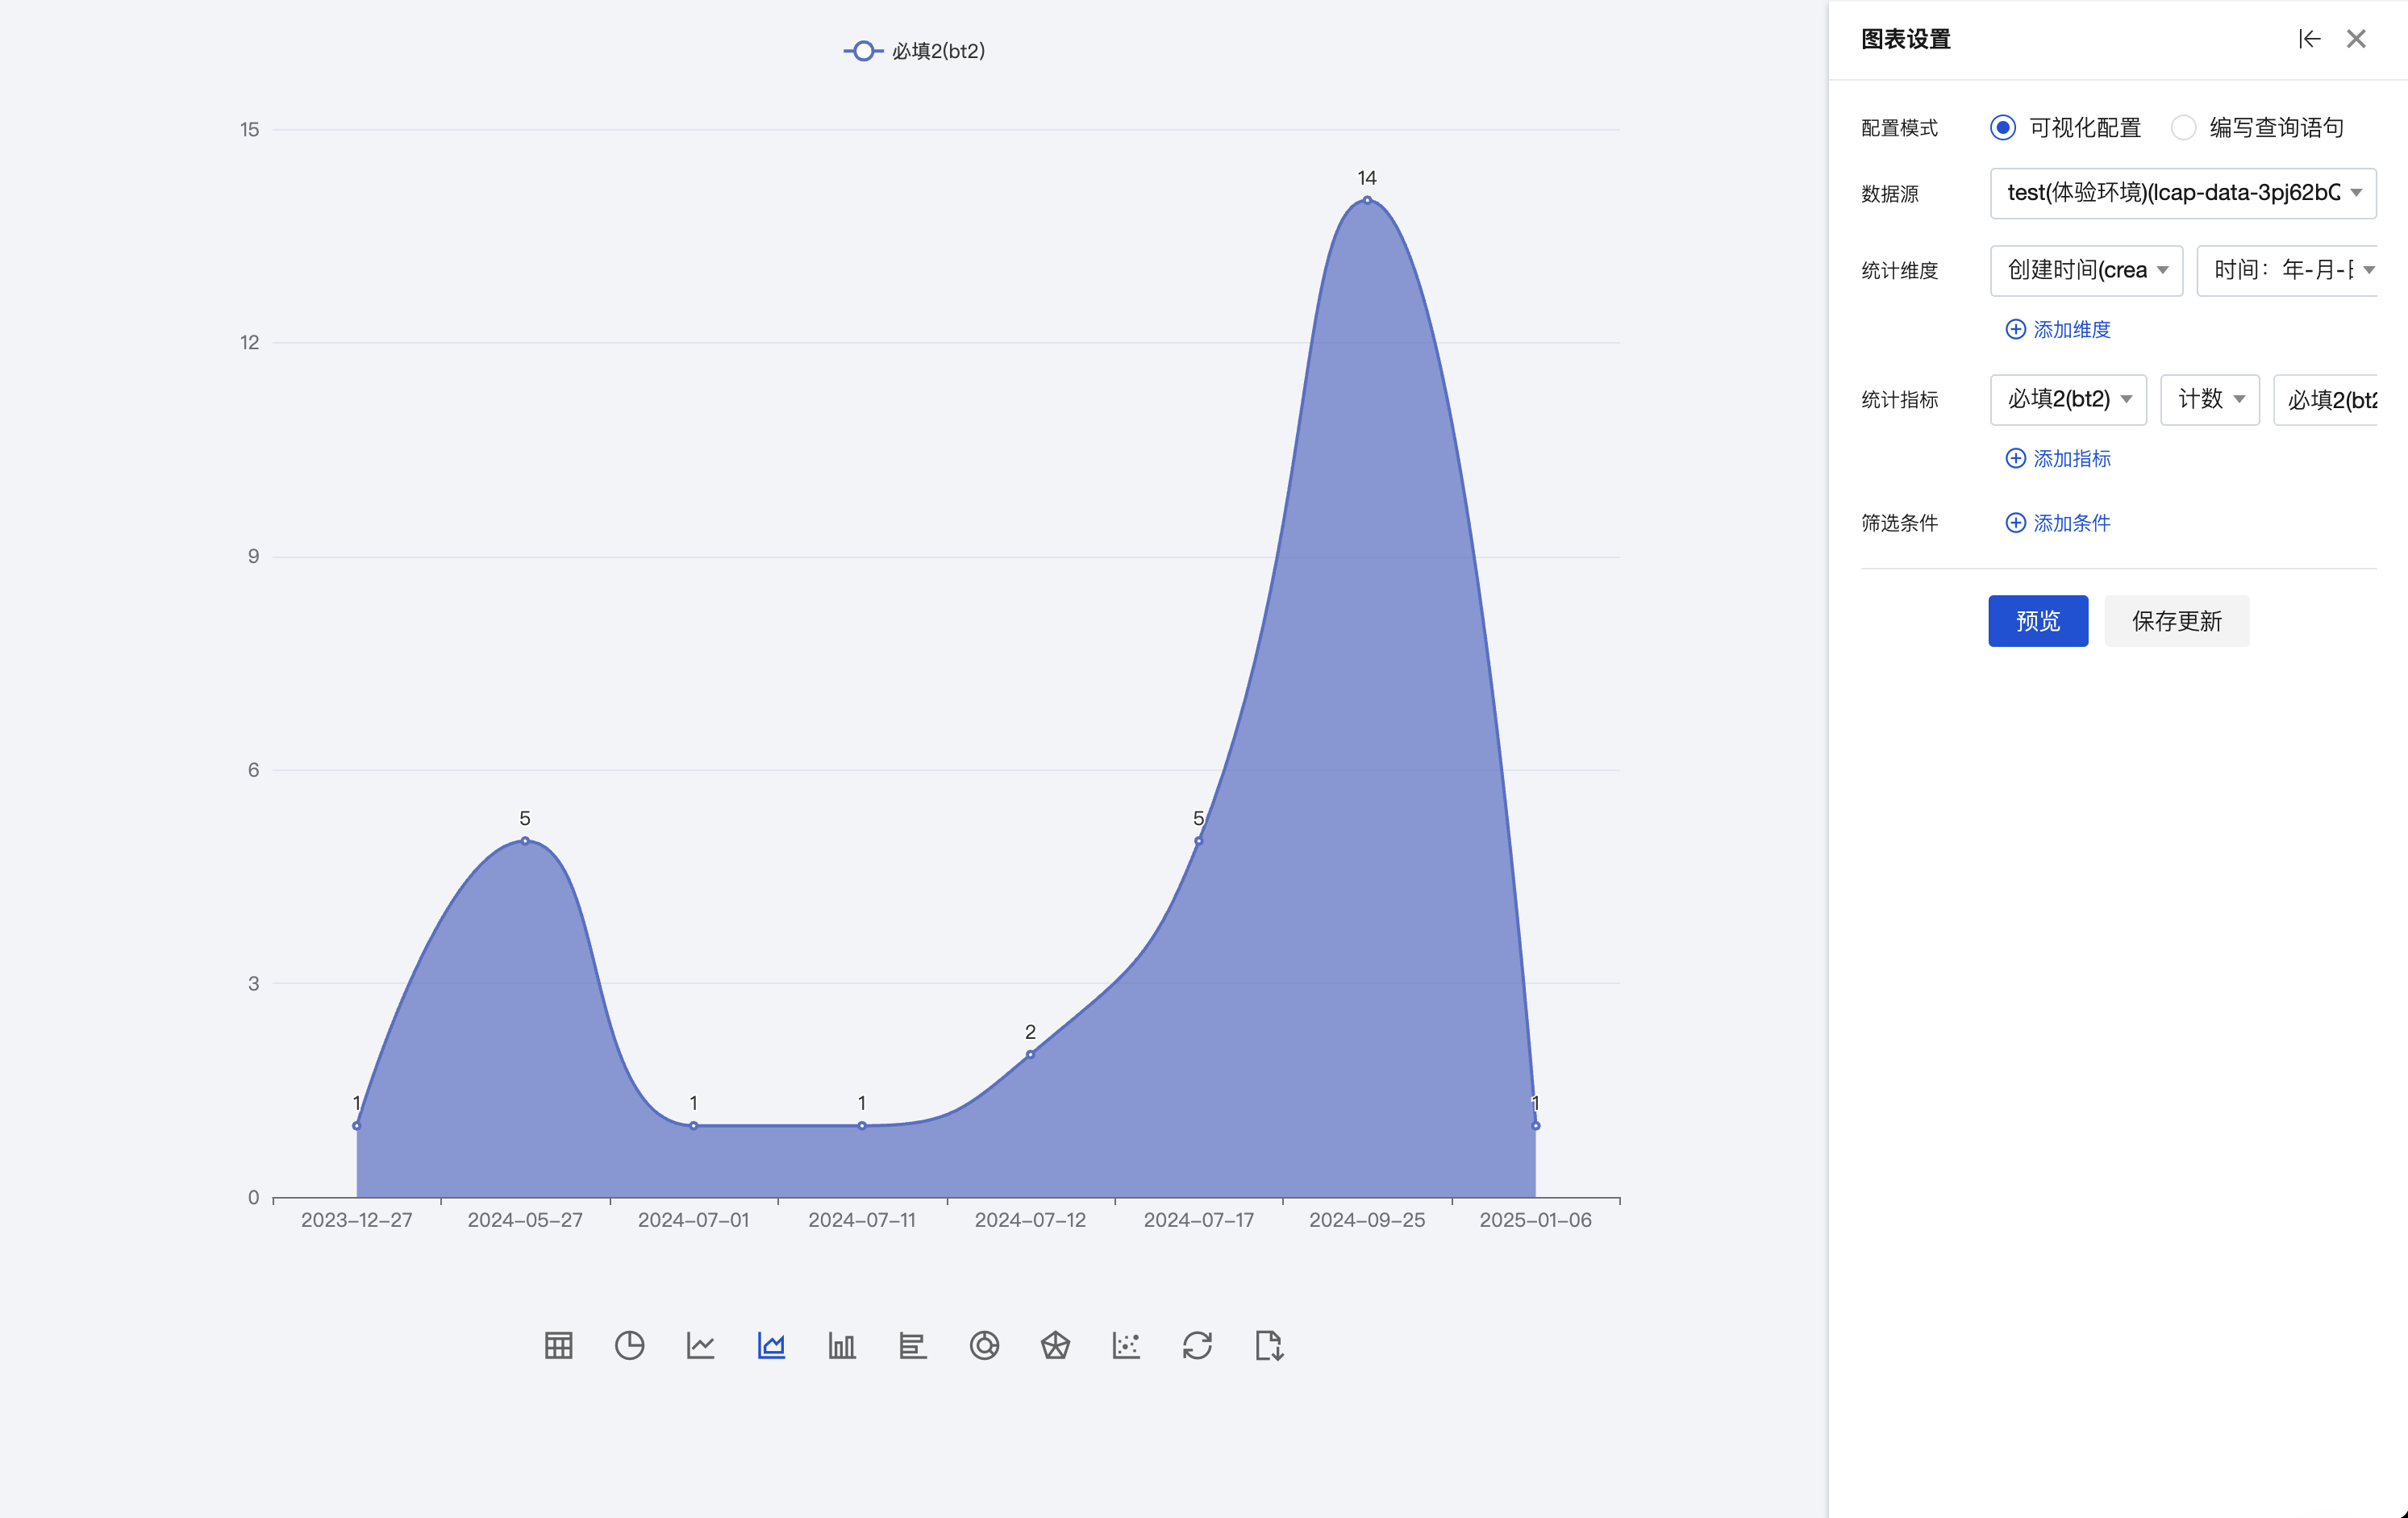
Visualization Chart Configuration
On the page, click to configure various settings for data statistics and flexibly generate various types of statistical charts.
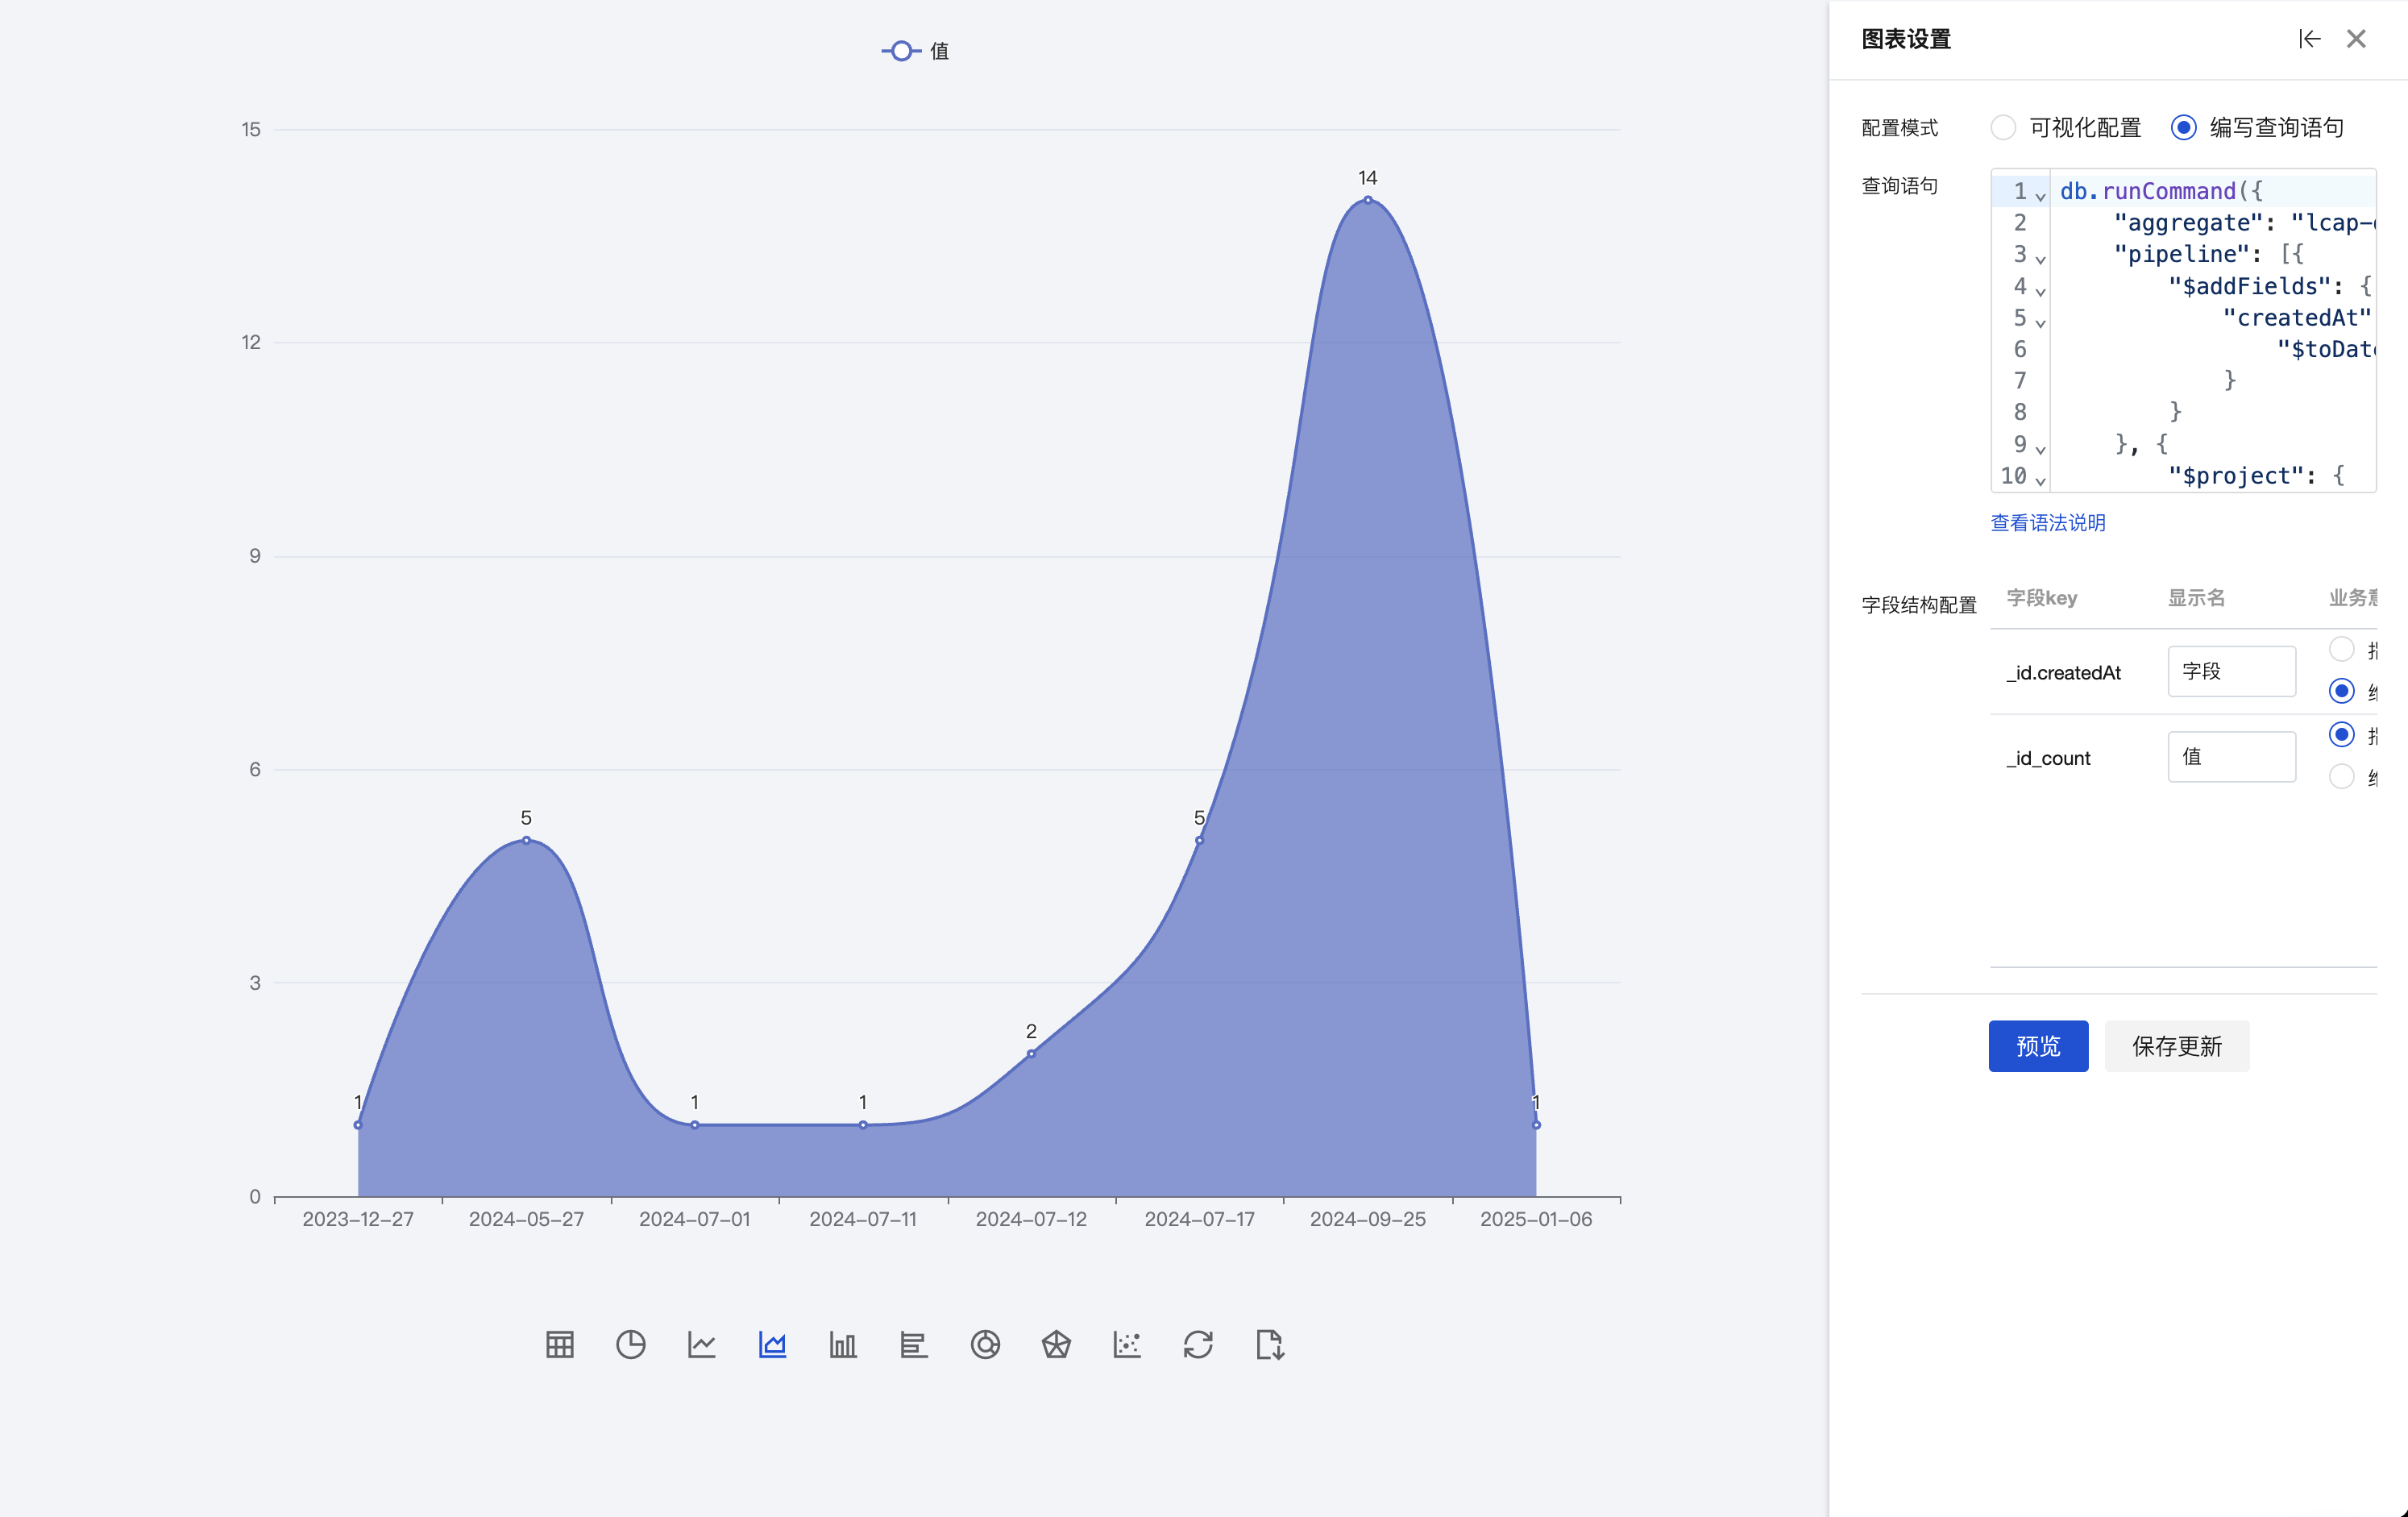
Writing Query Statements
Developers can manually write query statements to perform statistical analysis on data.
Query Statement Syntax Explanation:
Query statements support the MongoDB standard db.runCommand() method to execute aggregate operations, enabling complex data processing and analysis operations.
For the complete syntax, refer to db.runCommand() and db.collection.aggregate().
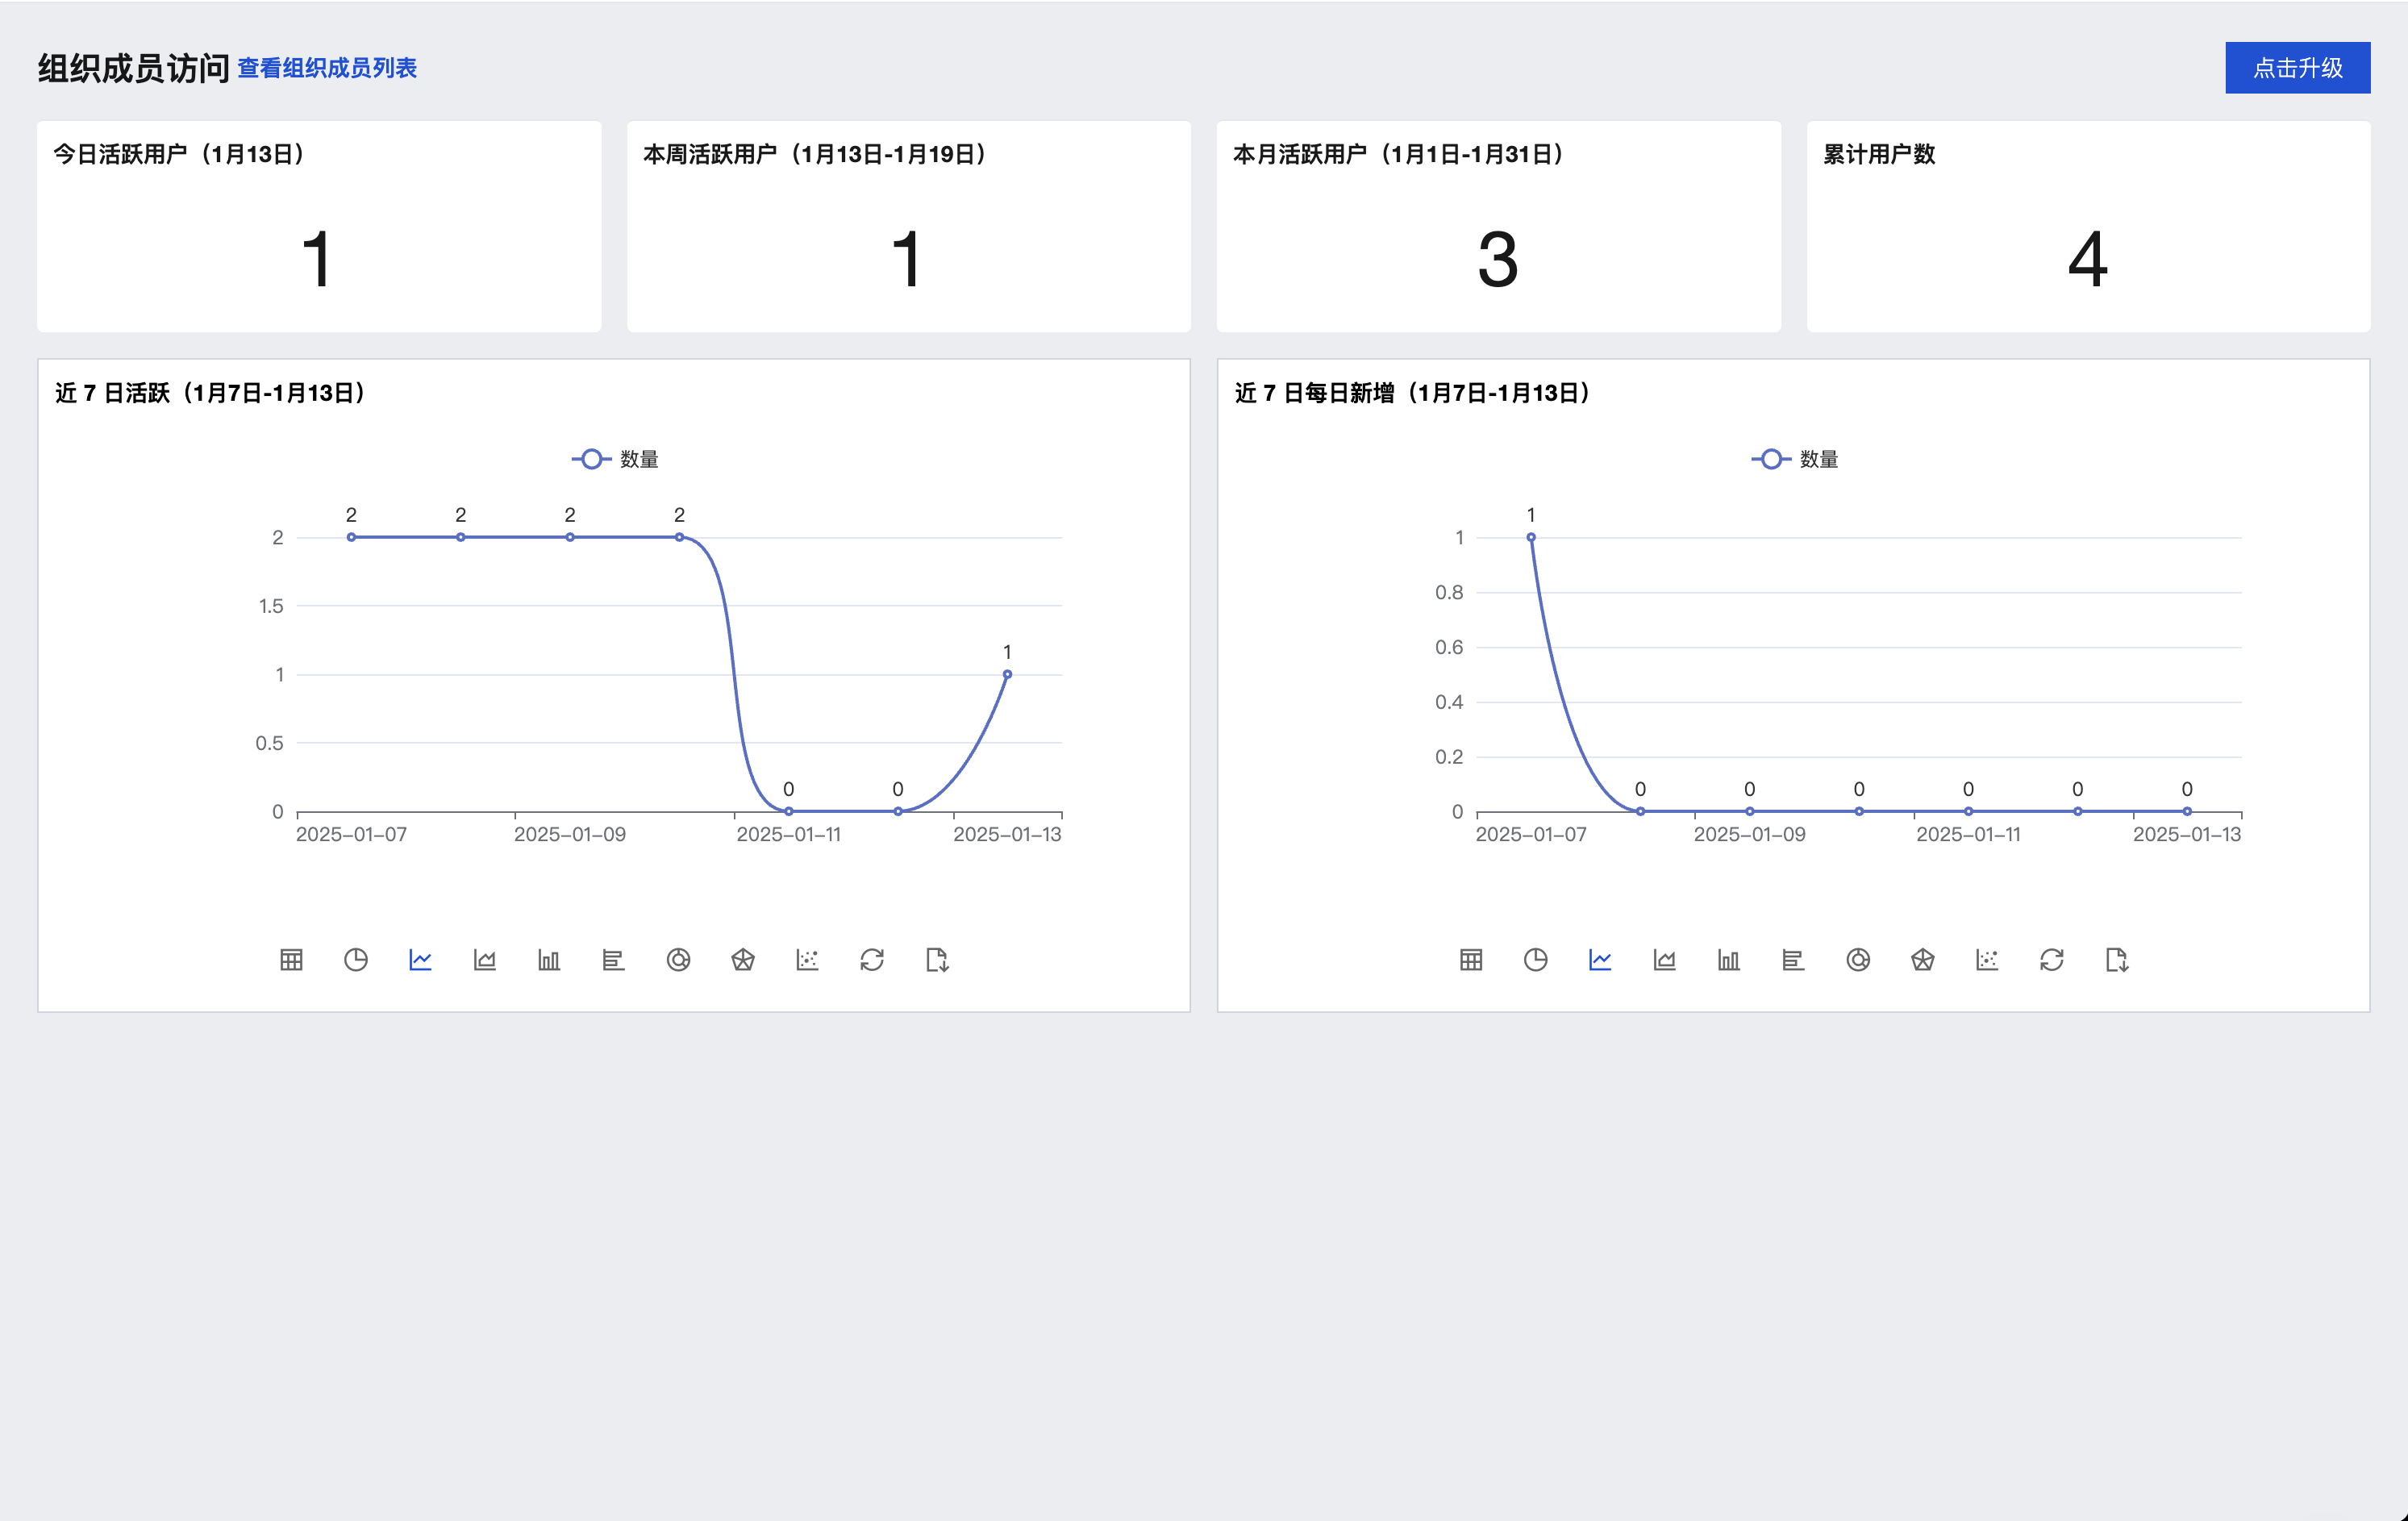
Built-in Enterprise Employee Access Analysis
Built-in "Enterprise Employee Access Kanban" enables real-time, dynamic observation of organization members' access to cloud development applications.
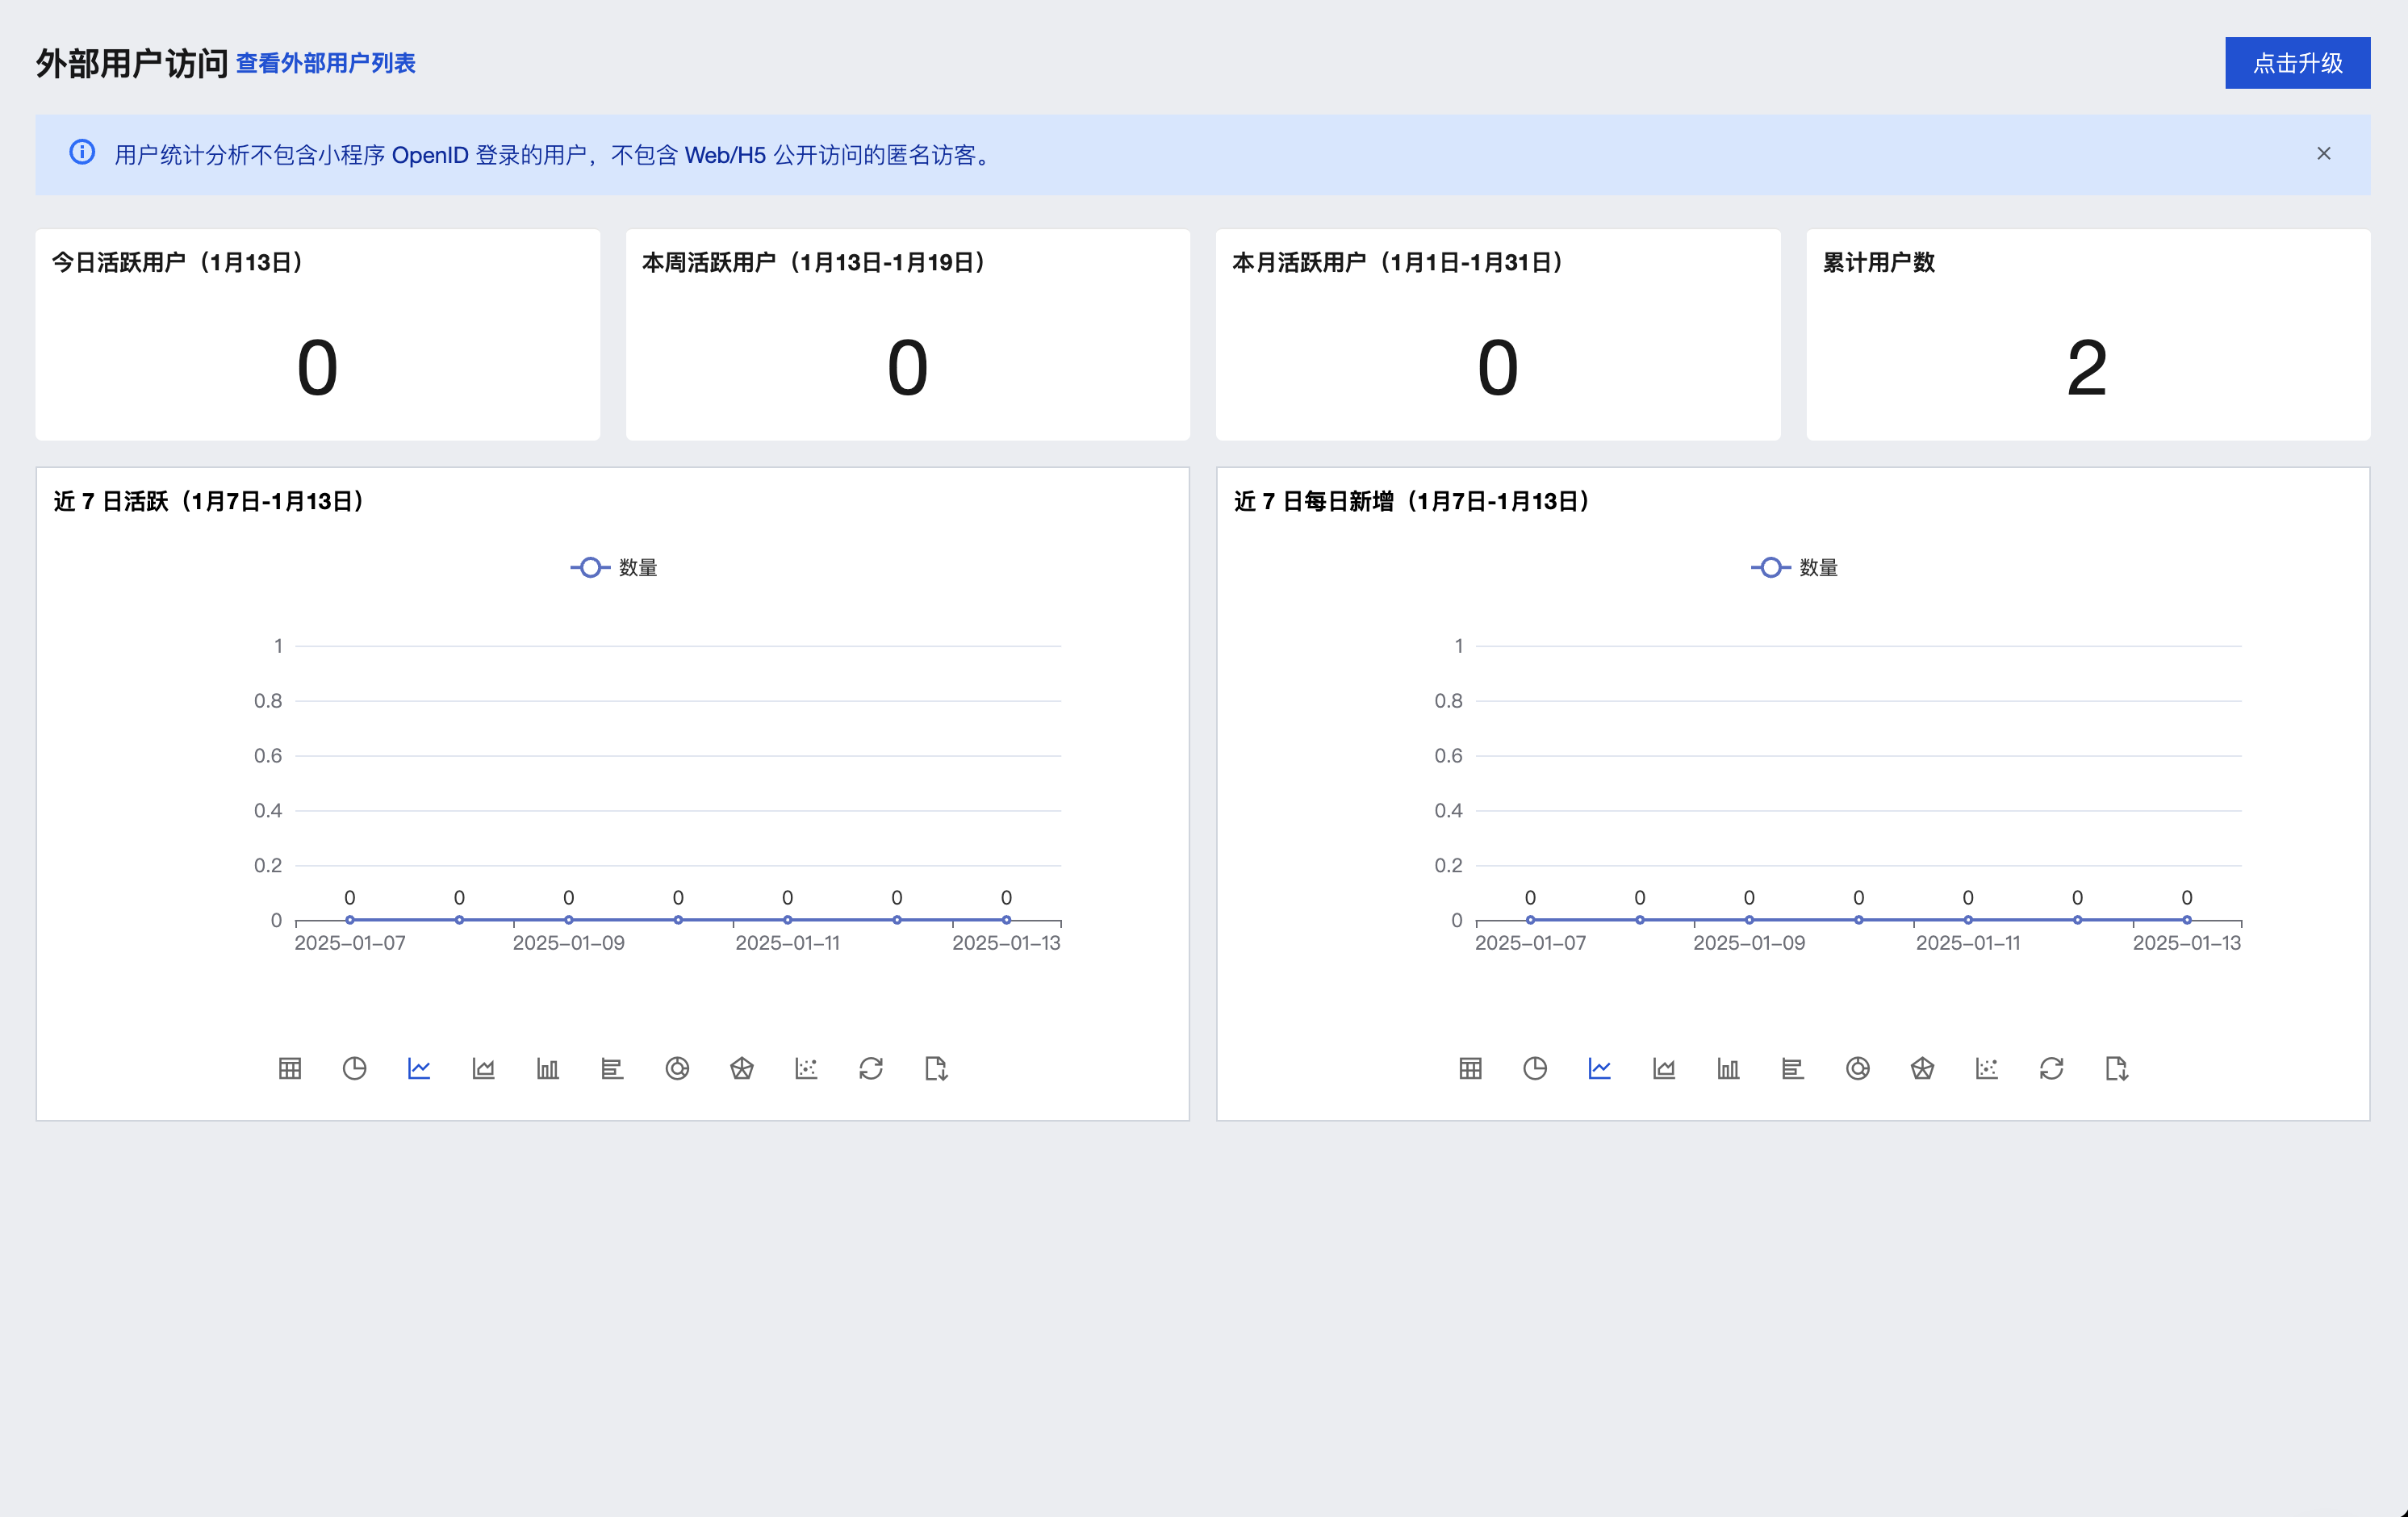
Built-in External User Activity Analysis
Built-in "External User Access Dashboard" enables real-time, dynamic monitoring of external users' access to cloud development applications.