How to debug function code?
In daily development processes, it is often necessary to debug code to efficiently complete feature development and problem diagnosis. Function Cloud Hosting supports two breakpoint debugging methods for users: online development and local development.
Online Development Breakpoint Debugging Method
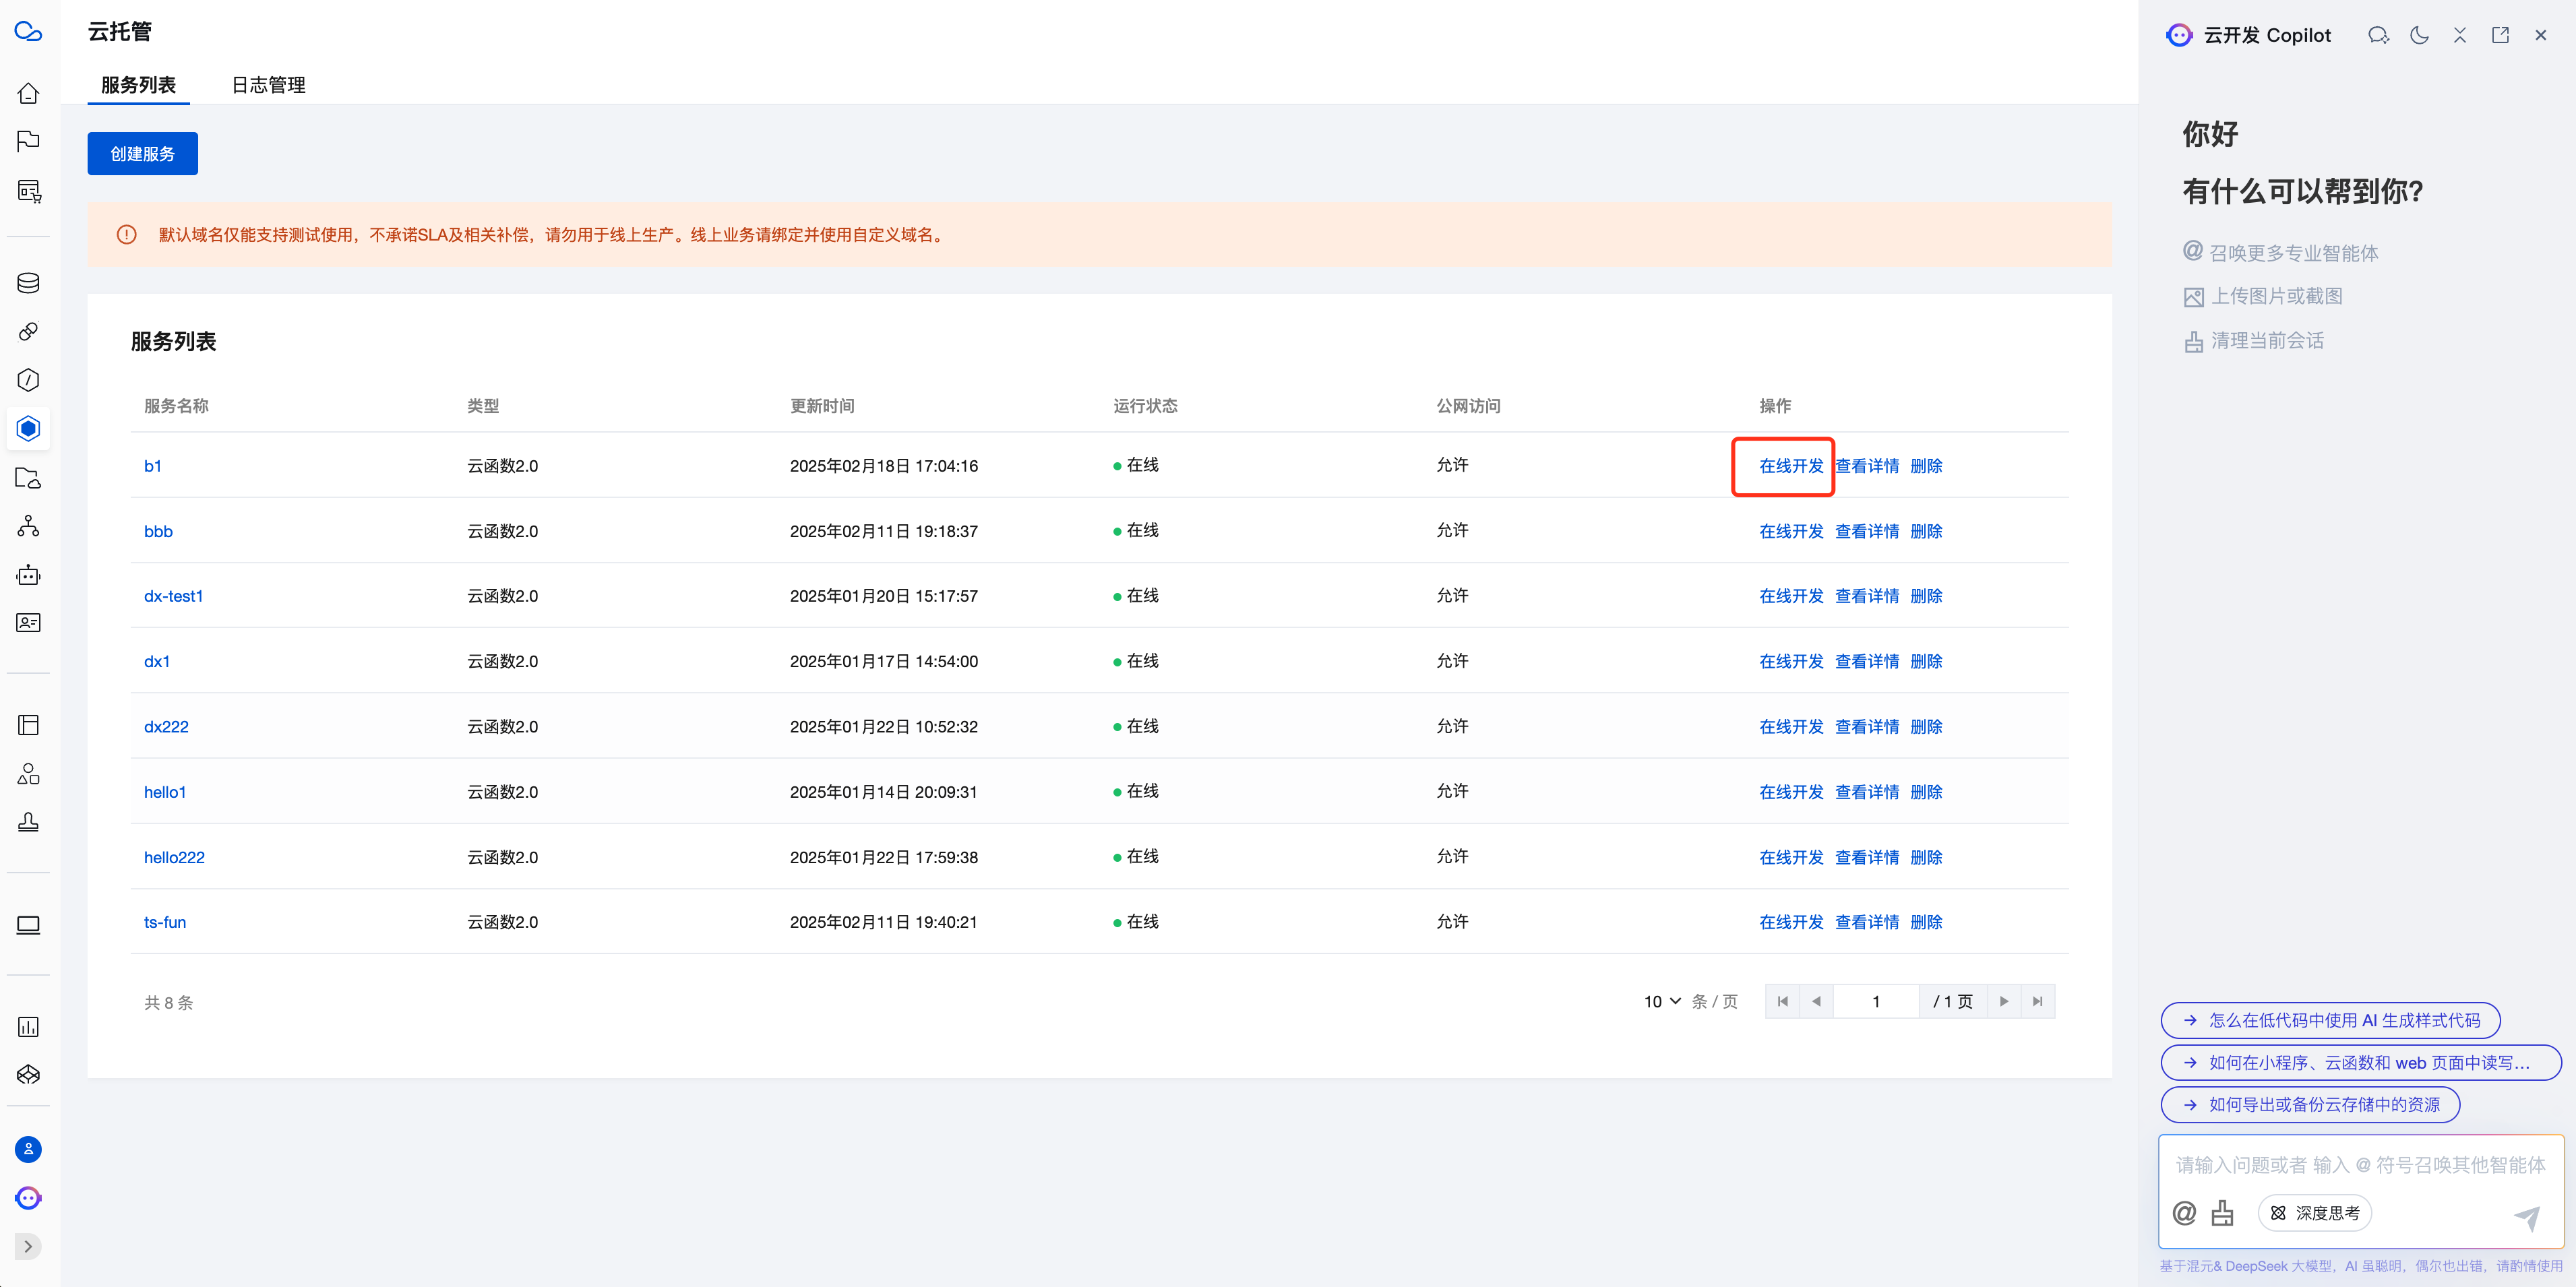
1. Enter "Online Development" Mode
On the Cloud Hosting list interface, locate the cloud function you want to debug, click its corresponding "Online Development" button to enter Online Development mode.
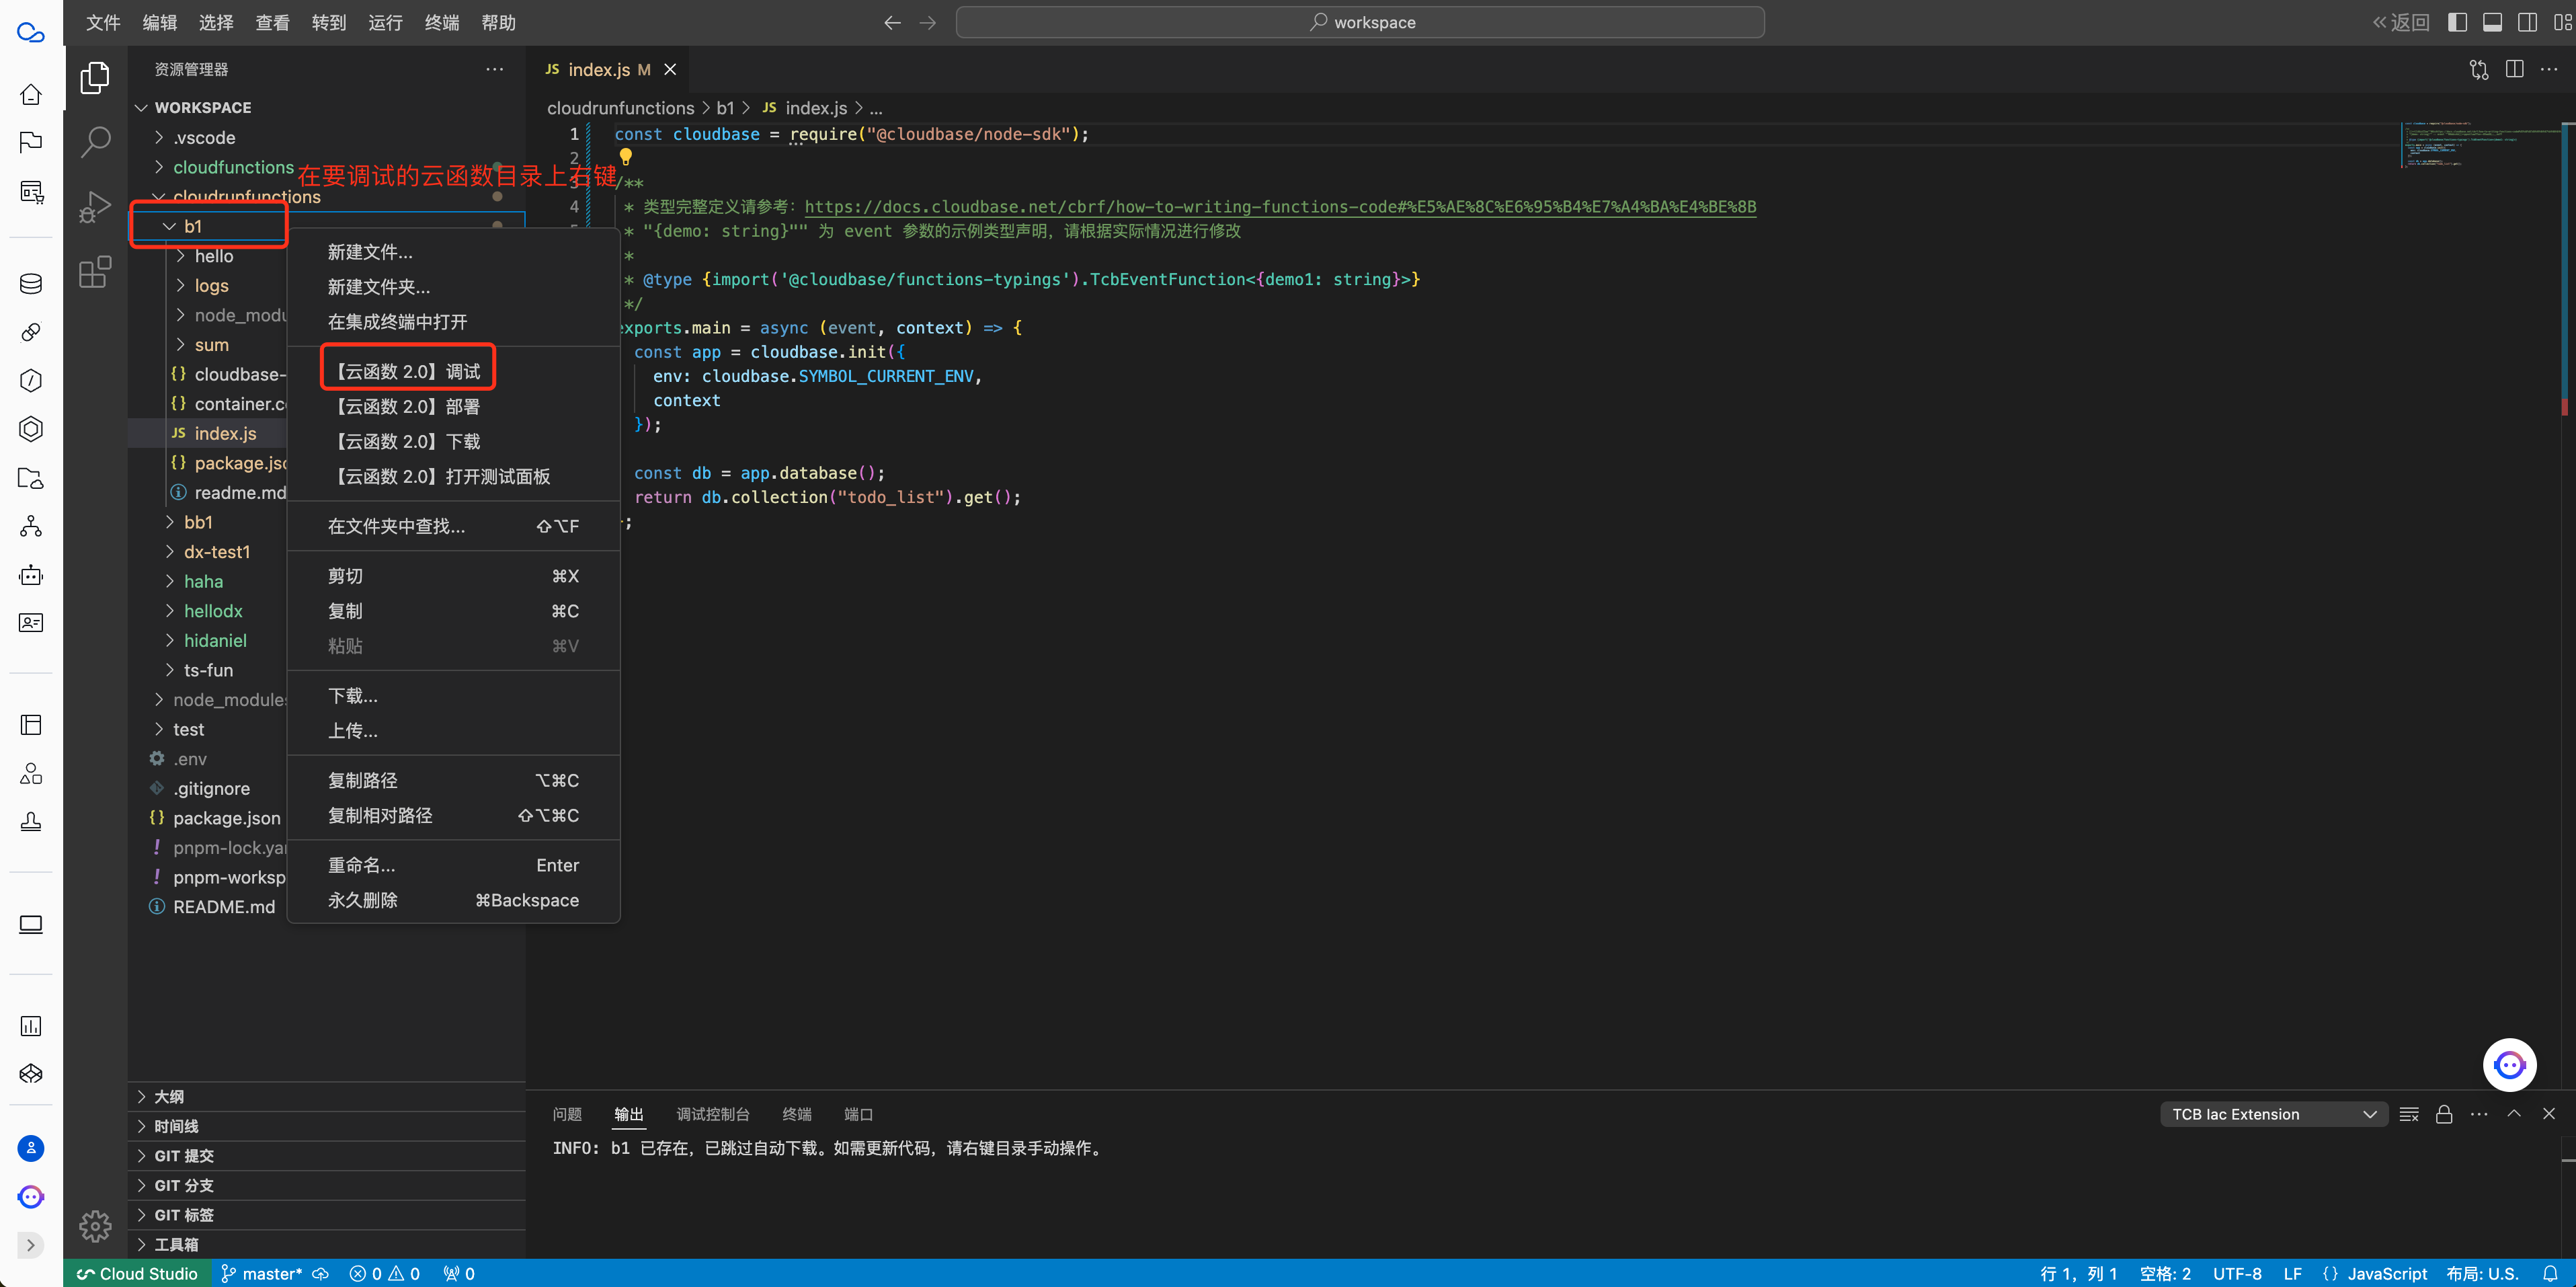
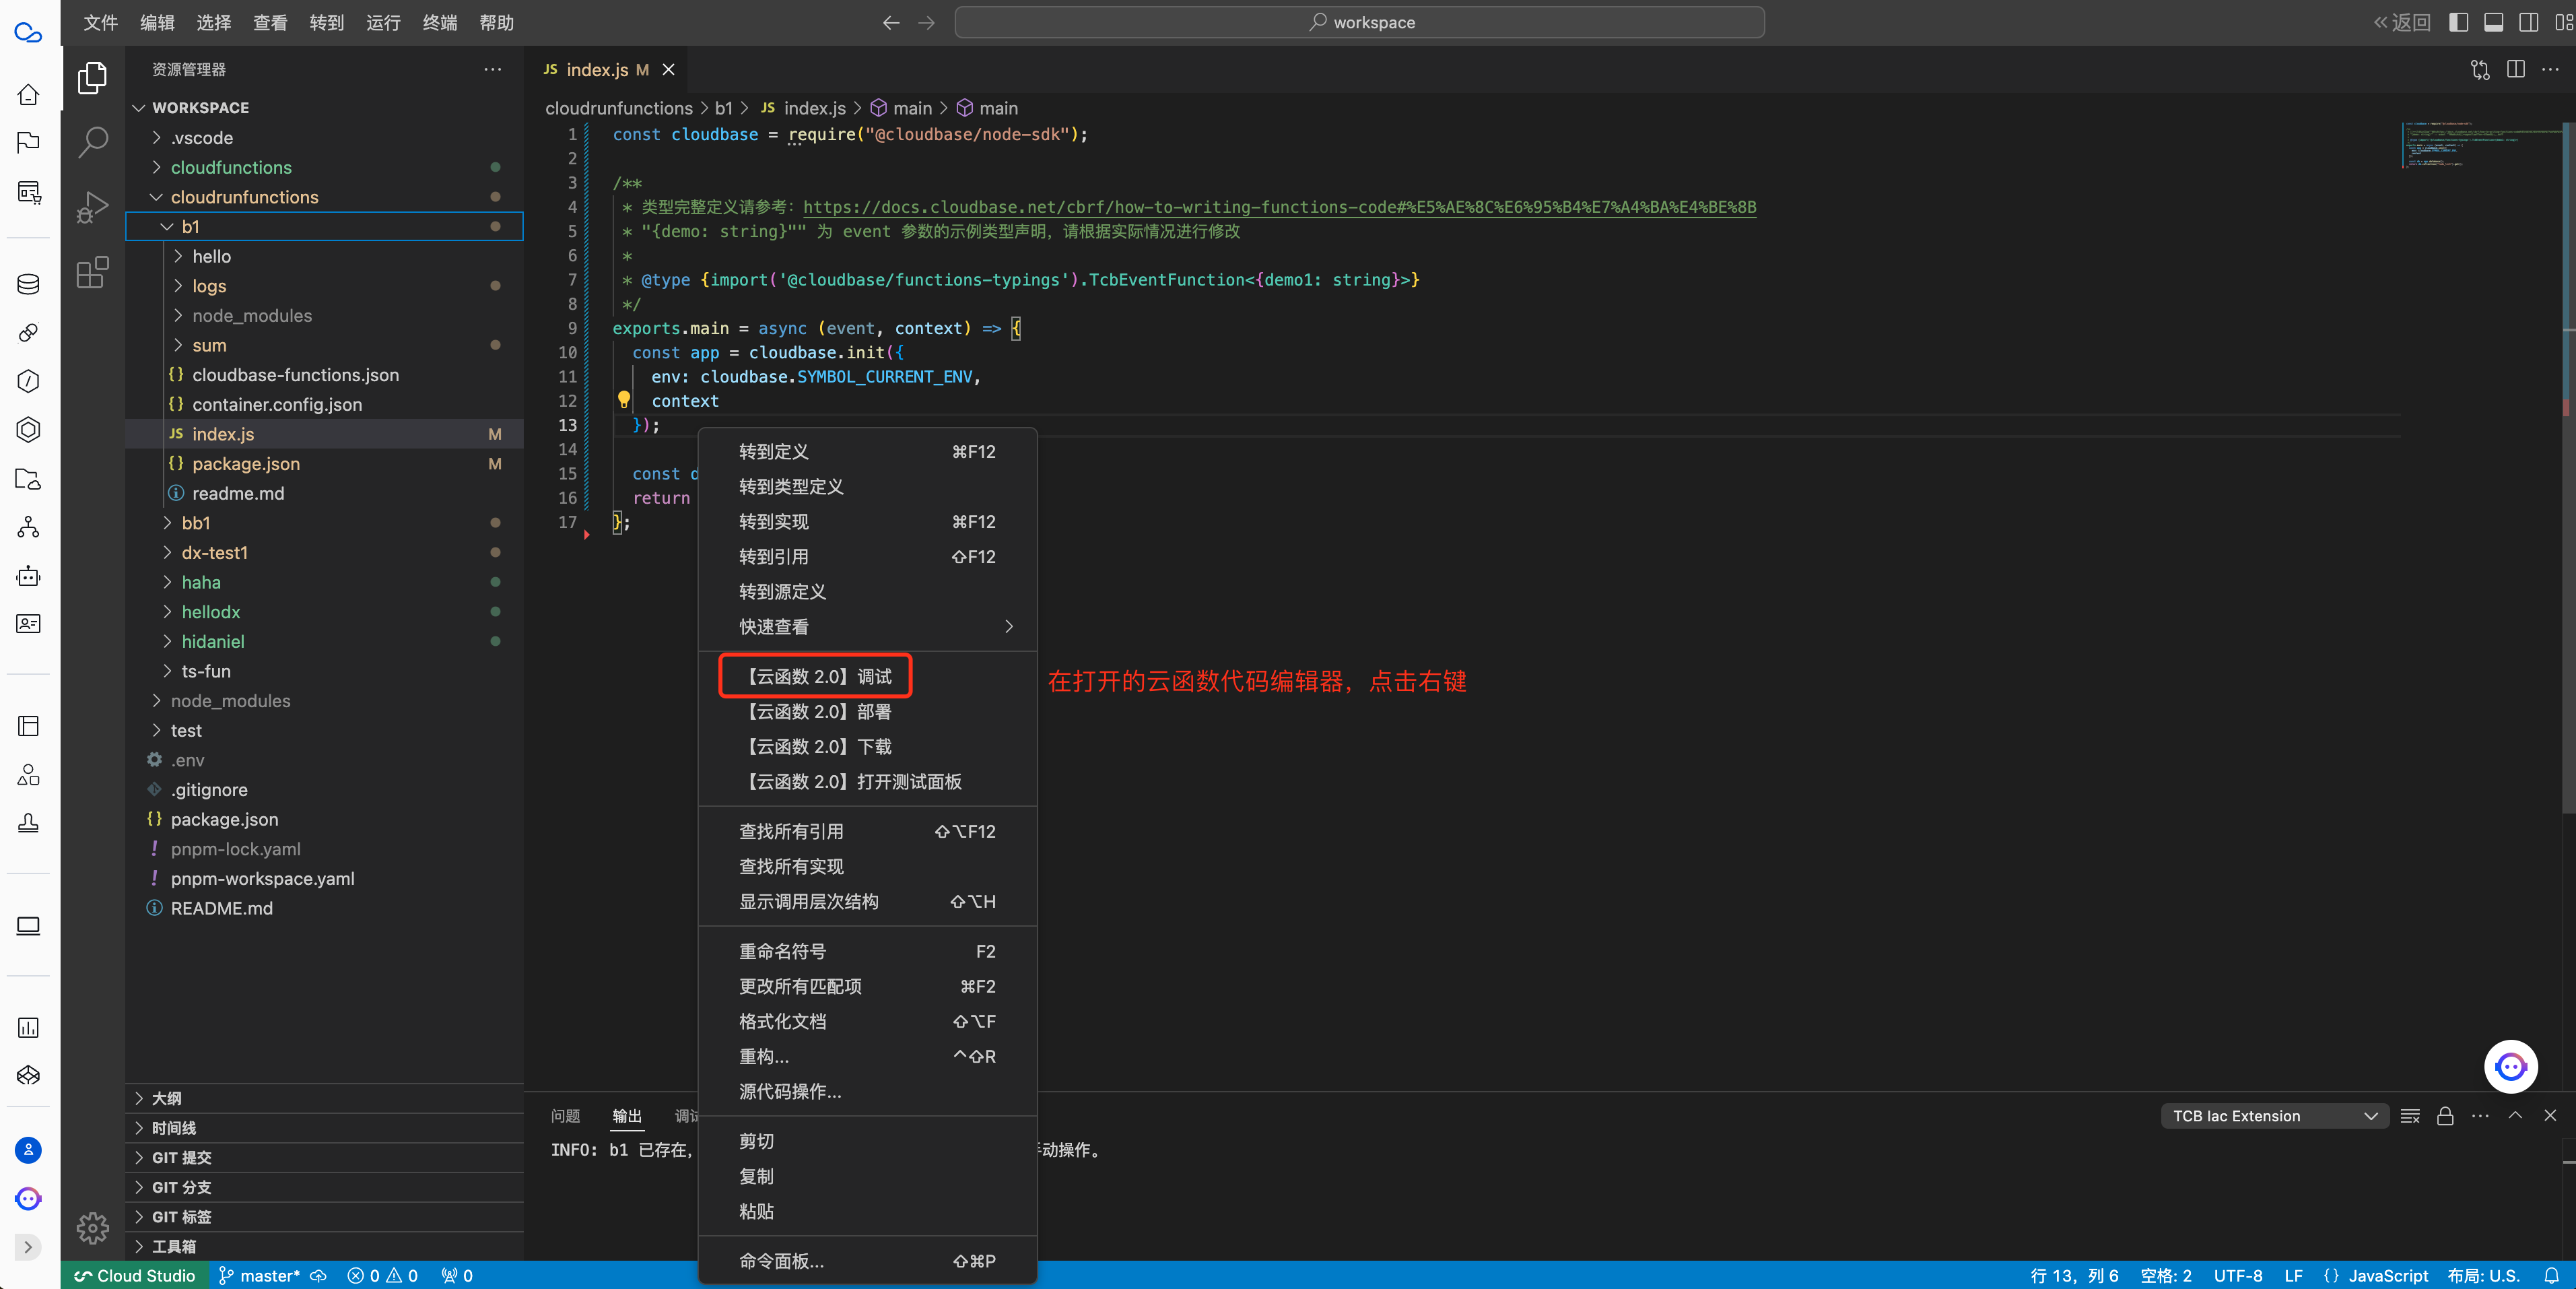
2. Click the "[Function Cloud Hosting] Debug" menu to start the debugging service
There are two places to access the "[Function Cloud Hosting] Debug" menu:
- One way is to right-click on the cloud function directory you want to debug
- Another way is to right-click within the open cloud function code editor
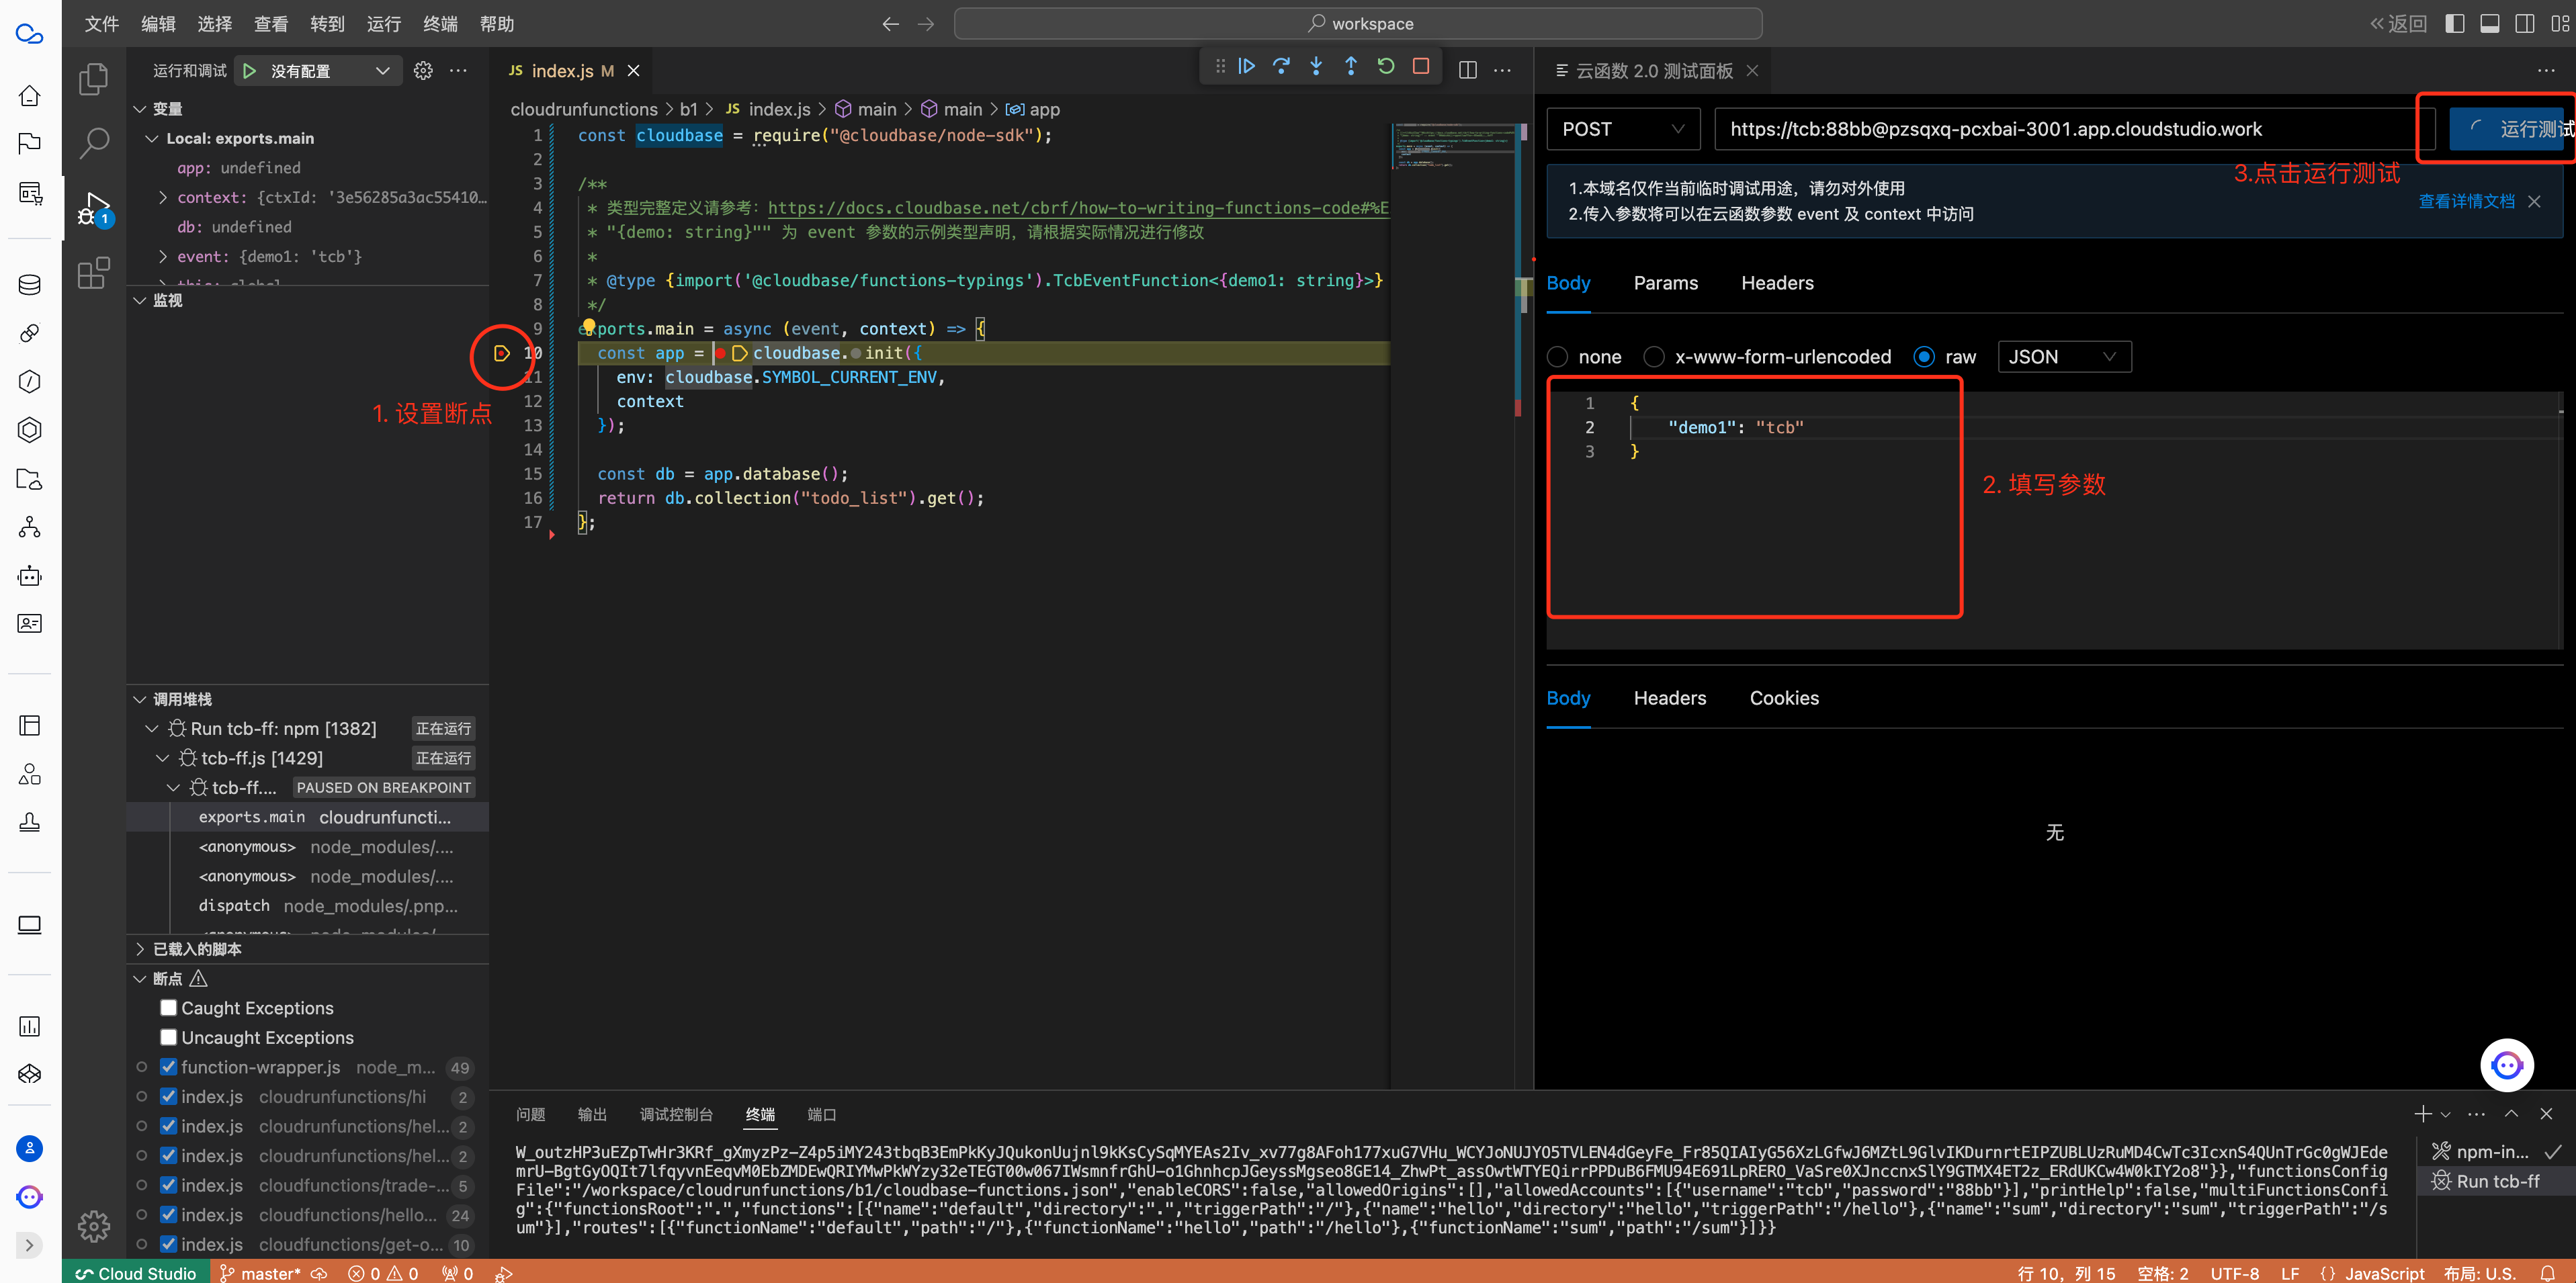
3. Set breakpoints, fill in parameters, and click "Run Test"
Wait for the debugging service to start, then you can begin debugging.
Local Development Breakpoint Debugging Method
Configuration Instructions
To debug via vscode, you need to create a .vscode/launch.json configuration file and configure it with the following reference content:
Note: The following configurations need to be adjusted according to the descriptions in the file comments.
{
  // Use IntelliSense to learn about possible attributes.
  // Hover to view descriptions of existing attributes.
  // For more information, visit: https://go.microsoft.com/fwlink/?linkid=830387
  "version": "0.2.0",
  "configurations": [
    {
      "type": "node",
      "request": "launch",
      "name": "launch-tcb-ff-global",
      // Note: Please ensure the @cloudbase/functions-framework module is installed globally
      // npm install -g @cloudbase/functions-framework
      // In different environments, the global installation path may vary and requires manual replacement
      //    On Windows systems, you can use the `where tcb-ff` command to view the global installation path.
      //    On MacOS/Linux systems, you can use the `which tcb-ff` command to view the global installation path.
      "program": "please-replace-this-with-the-path-to-your-global-tcb-ff",
      // In single-instance multi-function mode, you can specify the function configuration file via the --functionsConfigFile parameter
      "args": ["--functionsConfigFile cloudbase-functions.json"],
      // In single-function mode, specify the function code directory via the --source parameter, which supports TS/JS code
      // Note: The --functionsConfigFile parameter will override the --source parameter
      // "args": ["--source func-abc"],
      "env": {
        // Using ts-node enables direct debugging of TypeScript code, which can be removed if not needed
        "NODE_OPTIONS": "--require ts-node/register/transpile-only"
      },
      "skipFiles": ["<node_internals>/**"],
      "outFiles": ["!**/node_modules/**"]
    },
    {
      "type": "node",
      "request": "launch",
      "name": "launch-tcb-ff-local",
      // Note: Please ensure the @cloudbase/functions-framework module is installed in the current project
      // npm install @cloudbase/functions-framework
      "program": "${workspaceFolder}/node_modules/.bin/tcb-ff",
      // Directly launch the TypeScript function code in the src directory. If you need to debug the compiled JavaScript code, replace the --source parameter with the compiled directory
      // In single-instance multi-function mode, you can specify the function configuration file via the --functionsConfigFile parameter
      // Note: The functionsConfigFile parameter will override the --source parameter
      "args": ["--functionsConfigFile cloudbase-functions.json"],
      // In single-function mode, specify the function code directory via the --source parameter, which supports TS/JS code
      // "args": ["--source func-abc"],
      "env": {
        // Using ts-node enables direct debugging of TypeScript code, which can be removed if not needed
        "NODE_OPTIONS": "--require ts-node/register/transpile-only"
      },
      "skipFiles": ["<node_internals>/**"],
      "outFiles": ["!**/node_modules/**"]
    },
    {
      // Note: Before starting the debugging process, ensure the service has been launched via debugging commands such as `NODE_OPTIONS='--inspect=localhost:9229' tcb-ff .`
      "address": "localhost",
      "port": 9229, // Set port to 9229
      "localRoot": "${workspaceFolder}",
      // Debug by attaching to the Node.js process
      "name": "attach-to-remote-9229",
      "request": "attach",
      "skipFiles": ["<node_internals>/**"],
      "type": "node"
    }
  ]
}
The above configuration file contains three configuration methods of two types (launch/attach):
1. [Recommended] launch node process for debugging in vscode
This mode is divided into two different configurations:
launch-tcb-ff-global: Use the globally installedtcb-ffto run function codelaunch-tcb-ff-local: Use the locally installedtcb-ffto run function code
2. Debugging via attach in vscode
attach-to-remote-9229: Attach to the Node.js process on remote port 9229
If you use this method for debugging, you need to run the cloud function independently, which is more cumbersome compared to the launch method. The debugging steps are as follows:
First, manually execute the following command in the terminal:
# Specify the debug server port as 9229
NODE_OPTIONS="--inspect=localhost:9229" tcb-ff
Then, in vscode, start the debugging process by pressing the shortcut (F5) (or by selecting Attach to Remote 9229 in the Run And Debug interface to start debugging), and you can then begin breakpoint debugging.
Operation Example
Debugging TypeScript Code
This example demonstrates how to debug function code written in
TSusing the globally installedtcb-ffcommand, corresponding tolaunch-tcb-ff-globalin the configuration file.
Prerequisites: Install the functions-framework module globally via npm install -g @cloudbase/functions-framework, which includes the tcb-ff command
-
Download the sample code via
GitClone: https://github.com/TencentCloudBase/cloudbase-examples -
Open the
cloudbase-examples/cloudrunfunctions/ts-multiple-functionsexample code directory in vscode -
Dependencies can be installed using
npm/pnpm/yarn, for examplepnpm install. -
Replace
programin.vscode/launch.jsonwith the path to the globally installedtcb-ff -
Start debugging the function code
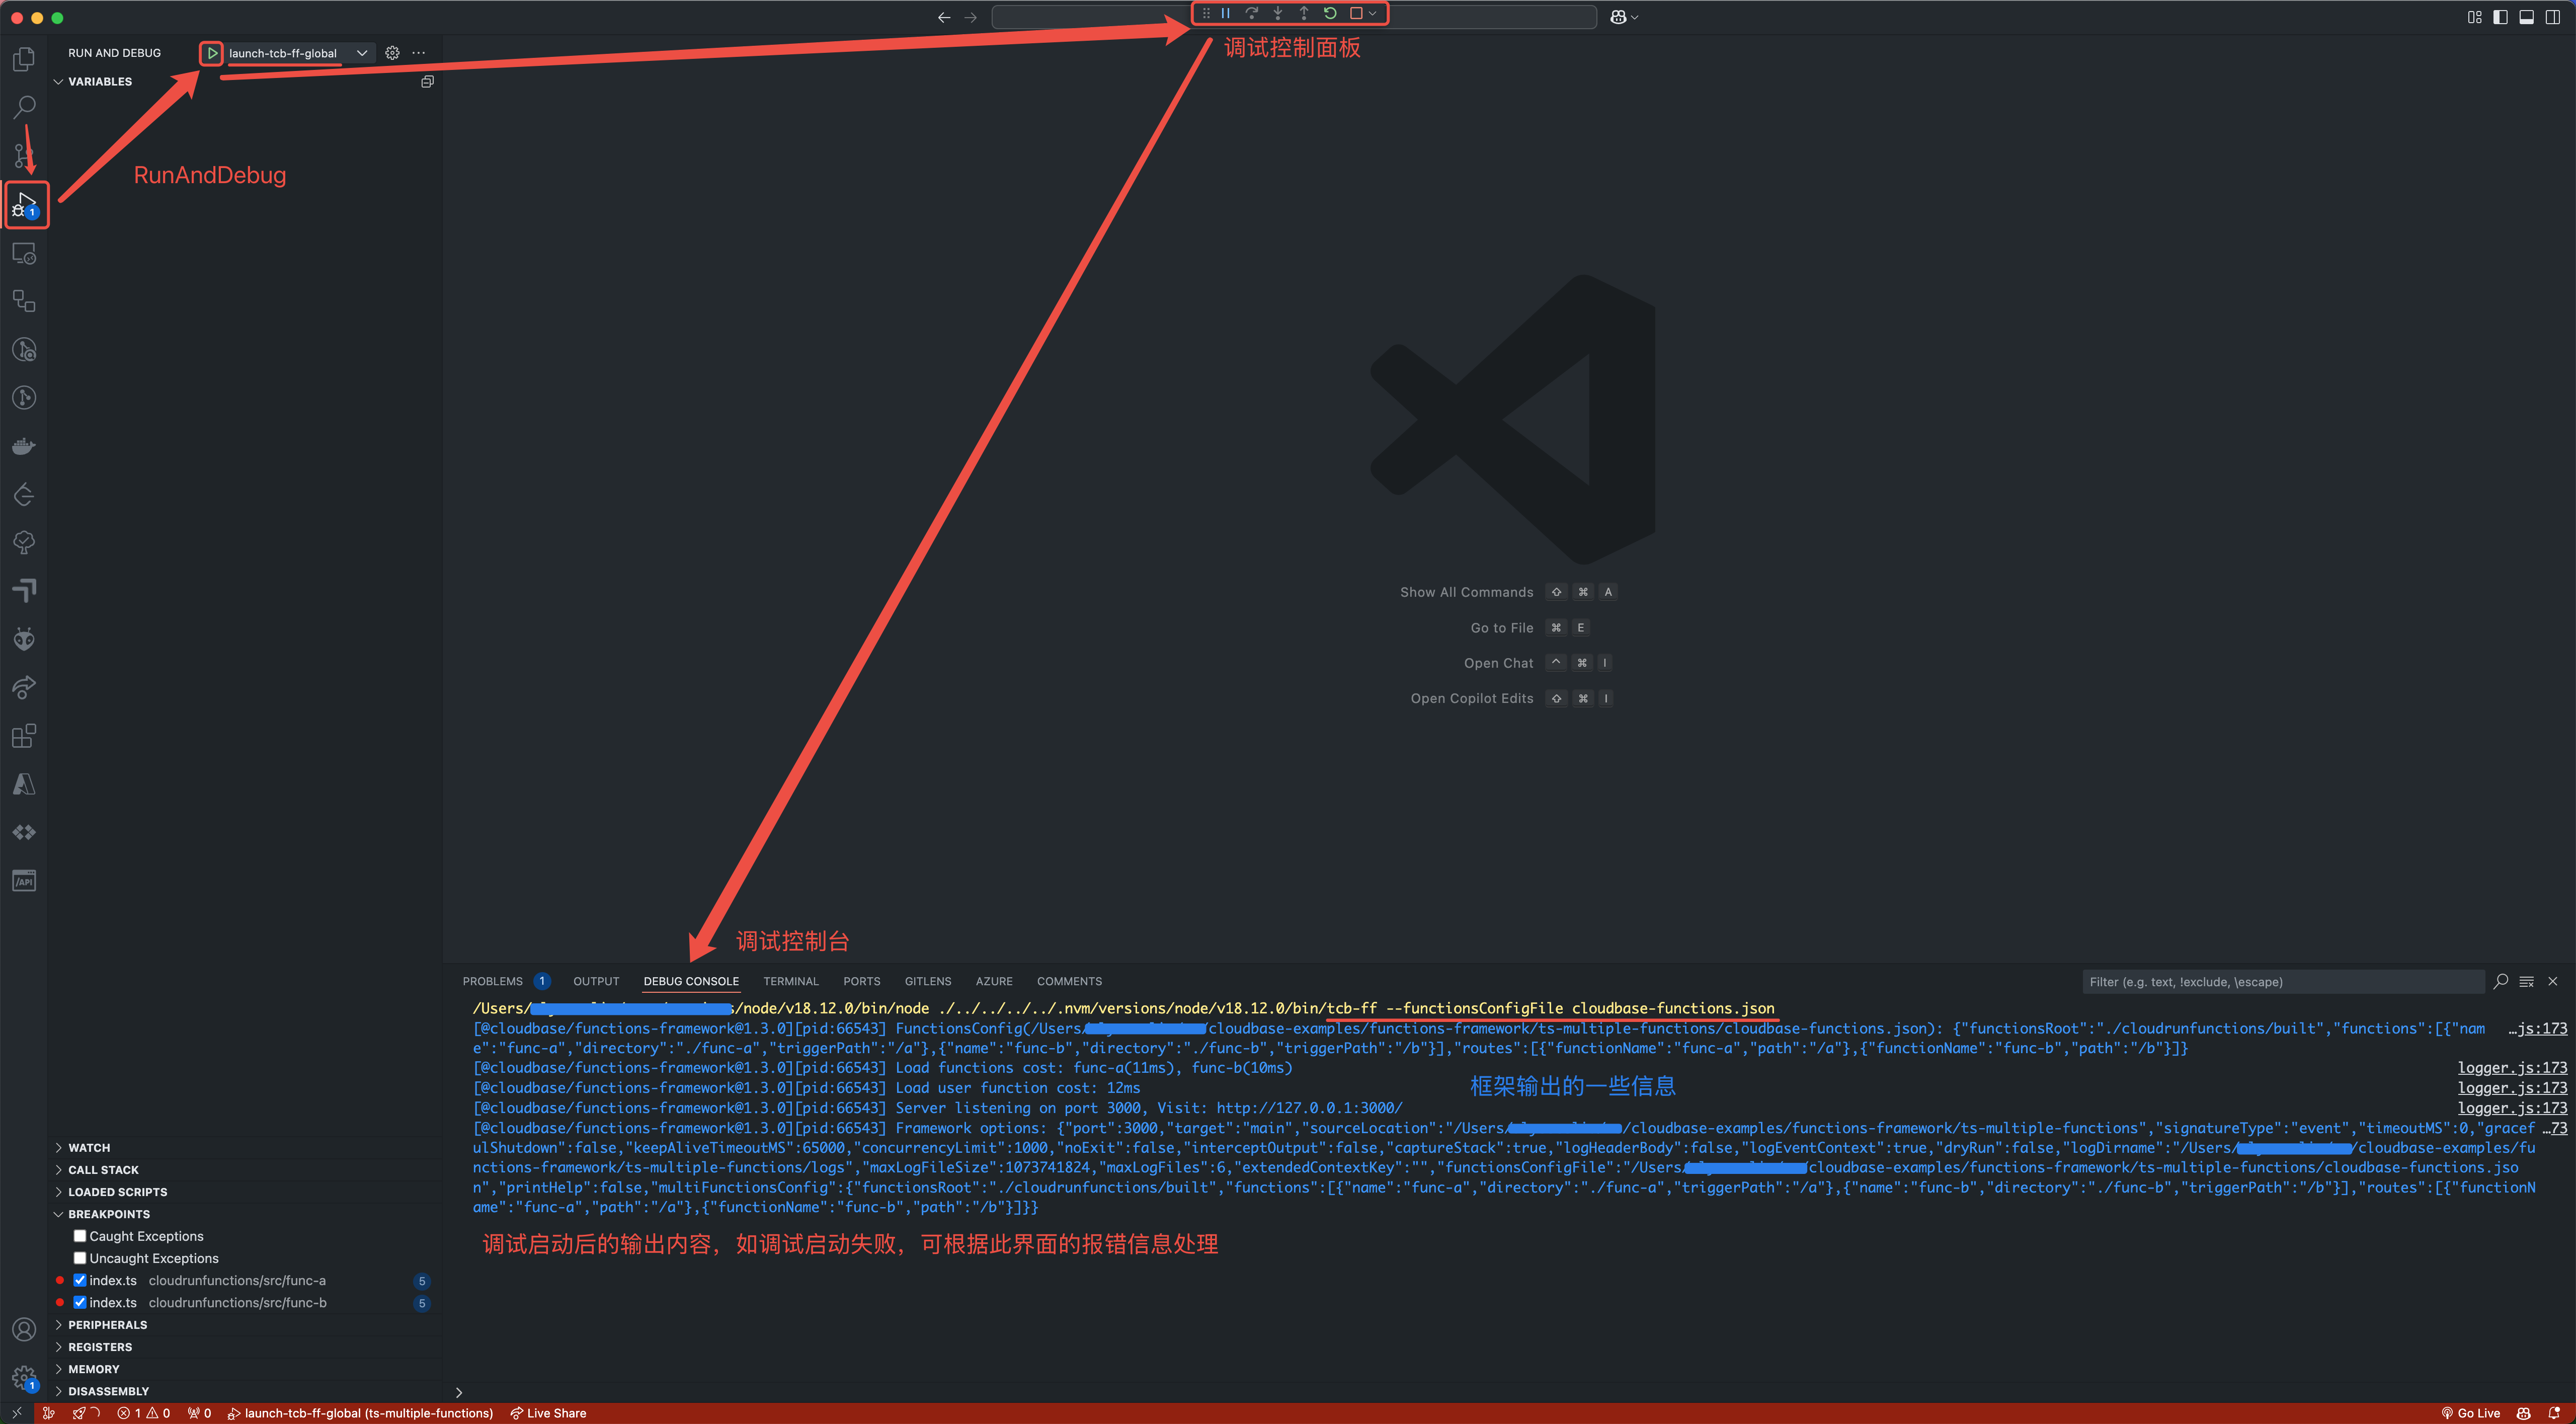
Debugging can be started in the RunAndDebug interface, with the operation path shown in the figure below:
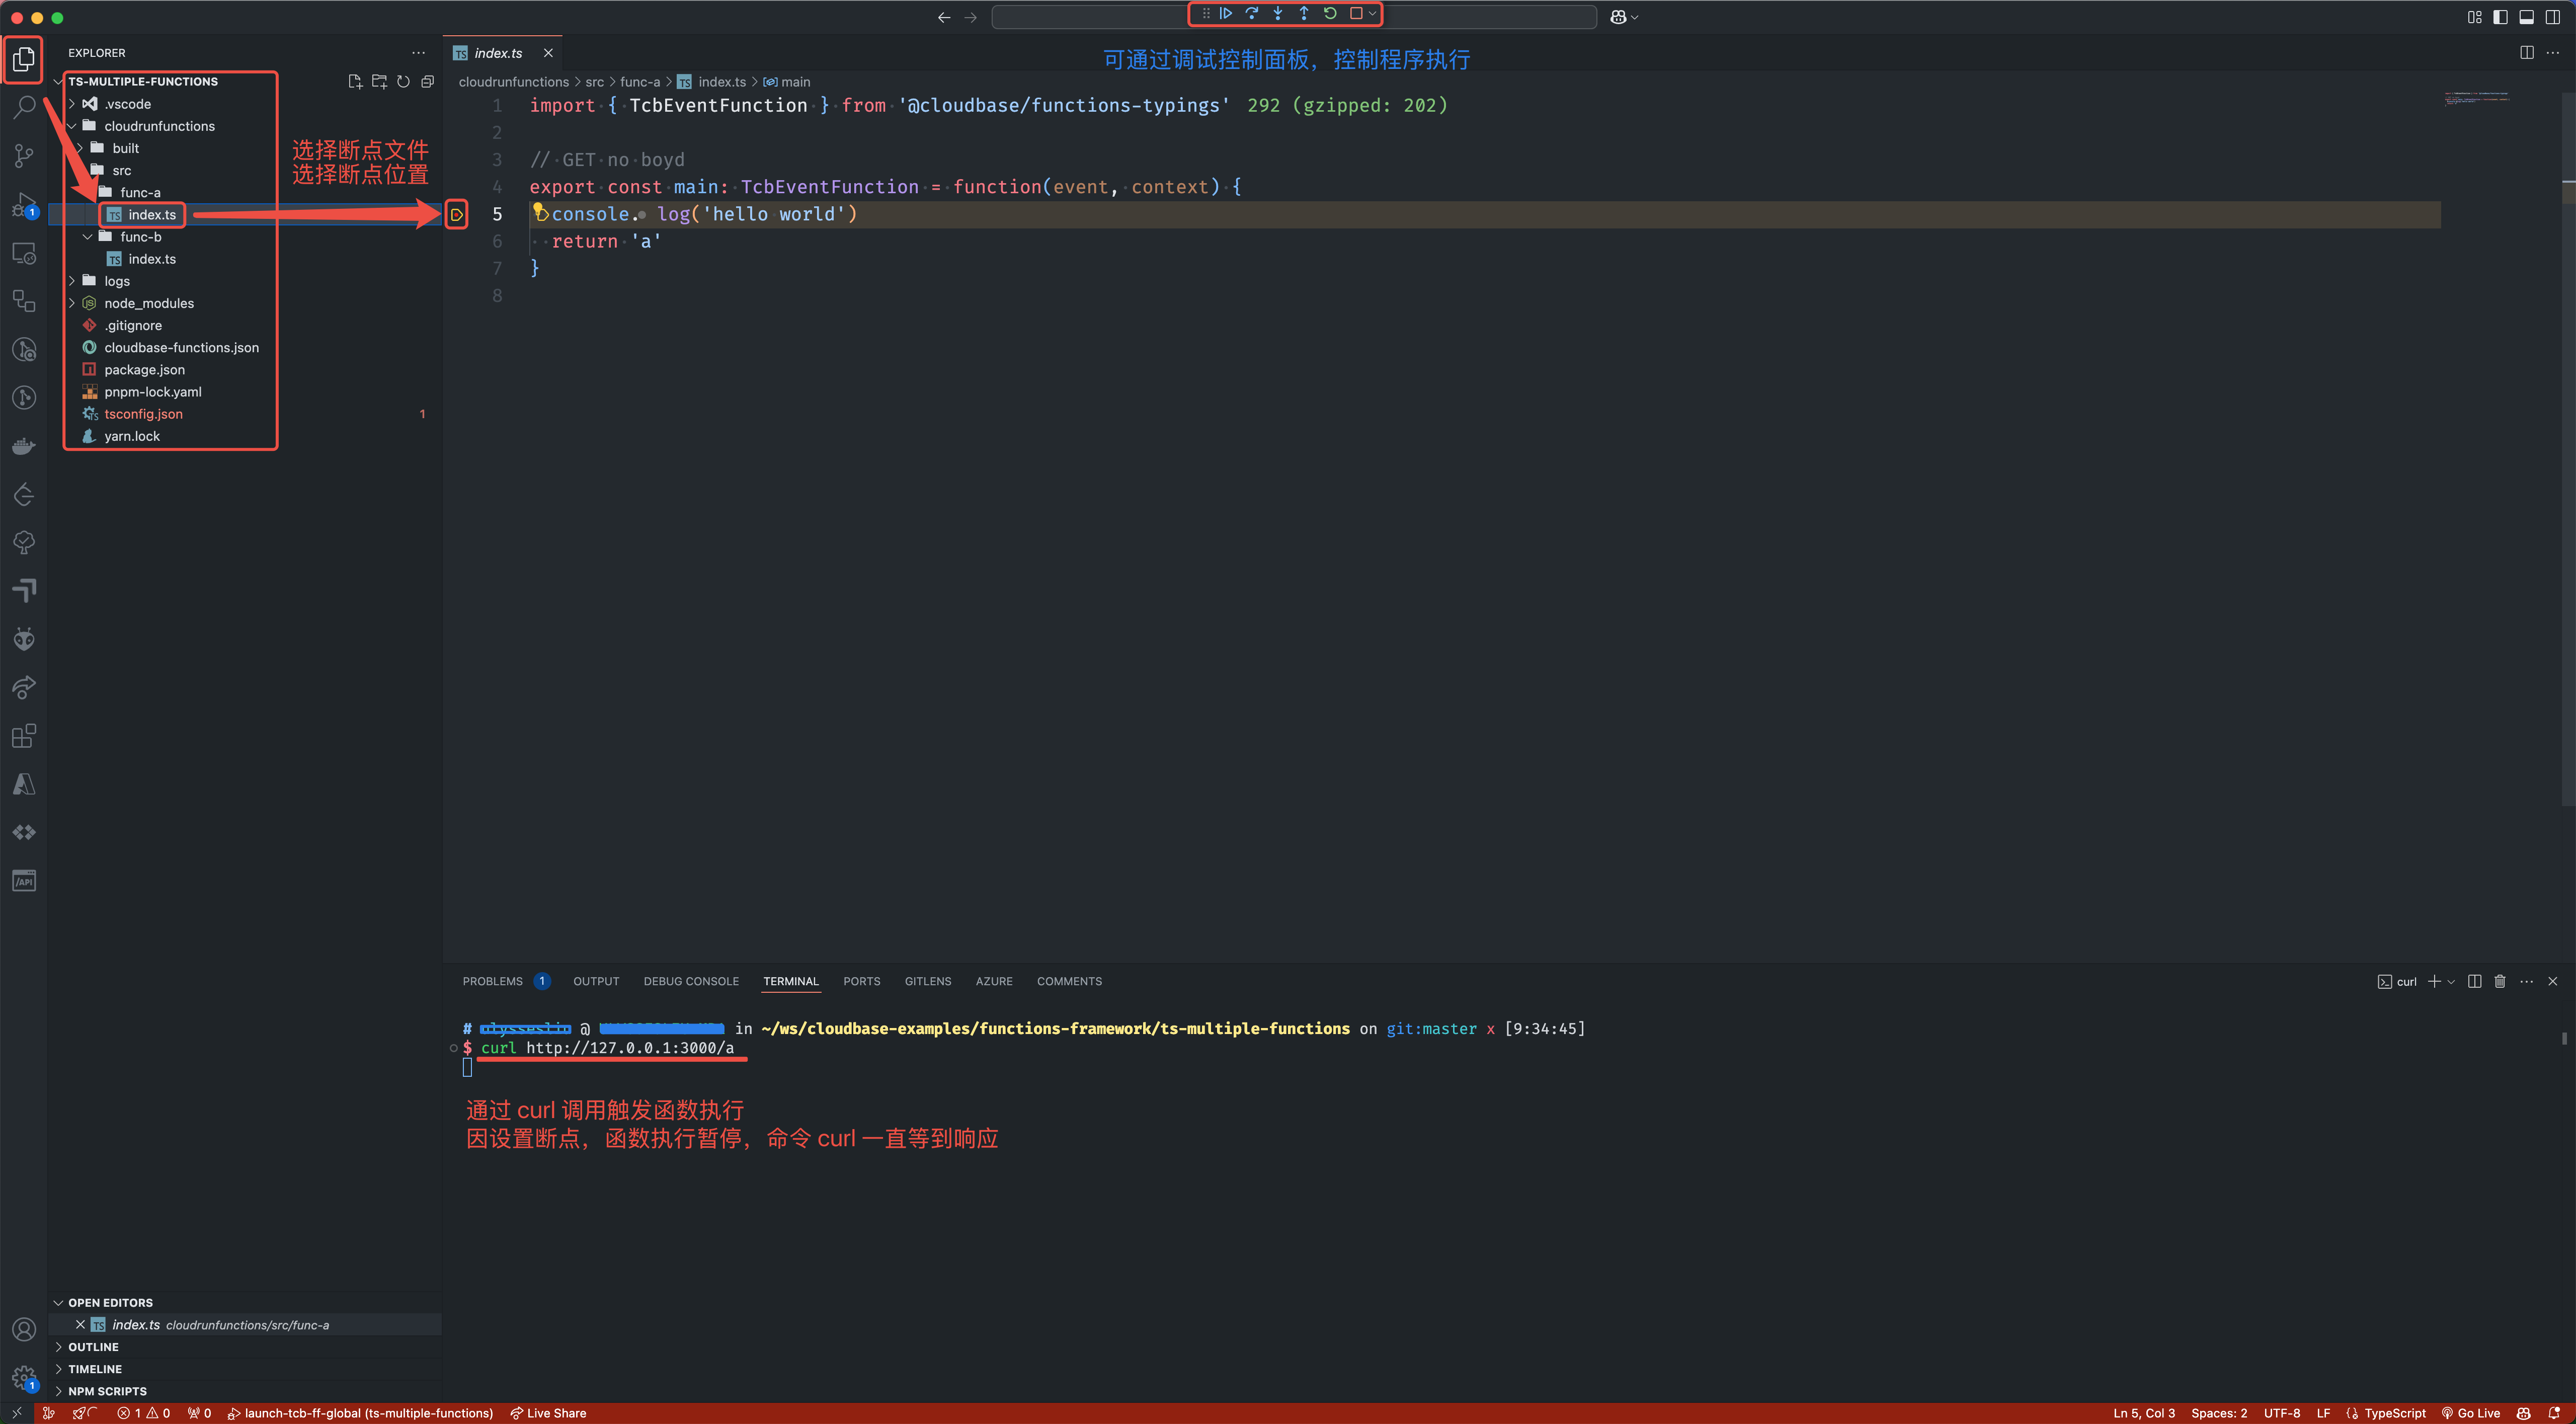
Set breakpoints and trigger function execution via curl invocation; the function will stop execution at the breakpoint:
You can return to the RunAndDebug interface to view the current function stack information:
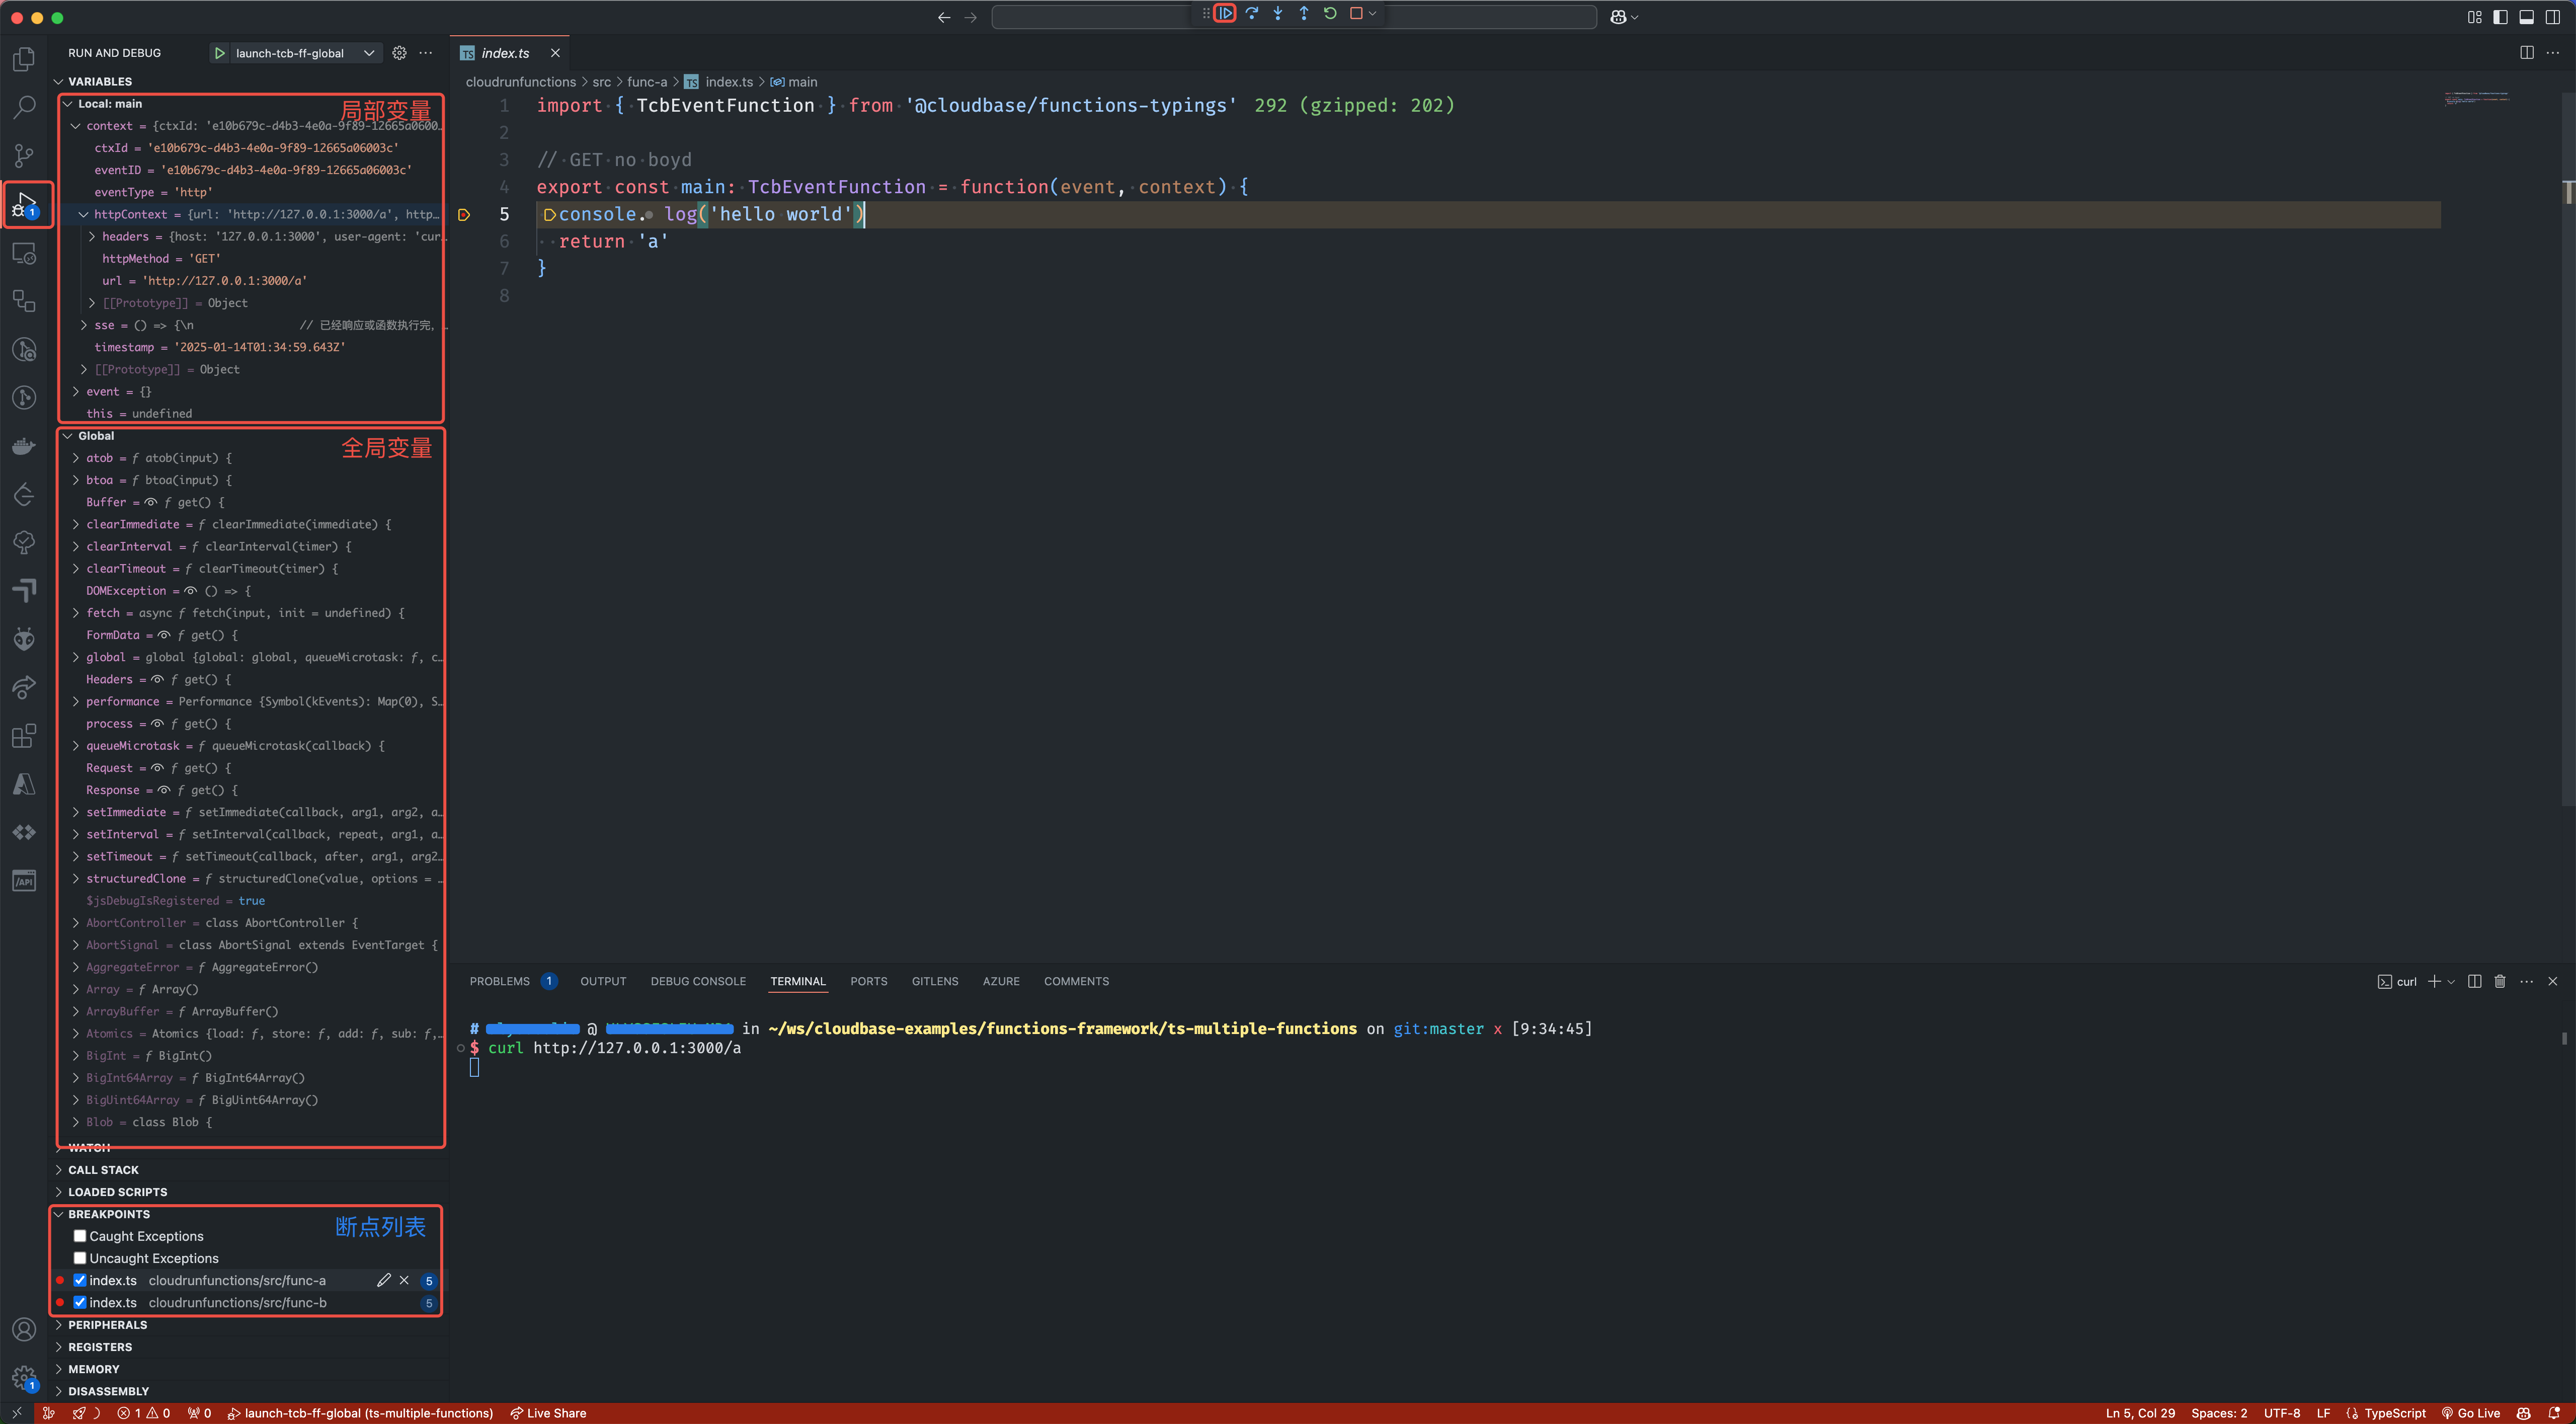
Click the Continue button in the Debug Control Panel, and the function will continue execution.
Debugging JavaScript Code
This example demonstrates how to debug function code written in
JSusing the locally installedtcb-ffcommand in the project, corresponding tolaunch-tcb-ff-localin the configuration file.
-
Download the sample code via
GitClone: https://github.com/TencentCloudBase/func-v2-template -
Open the
func-v2-templatesample code directory in vscode -
Dependencies can be installed using
npm/pnpm/yarn, for examplepnpm install. -
Start debugging the function code
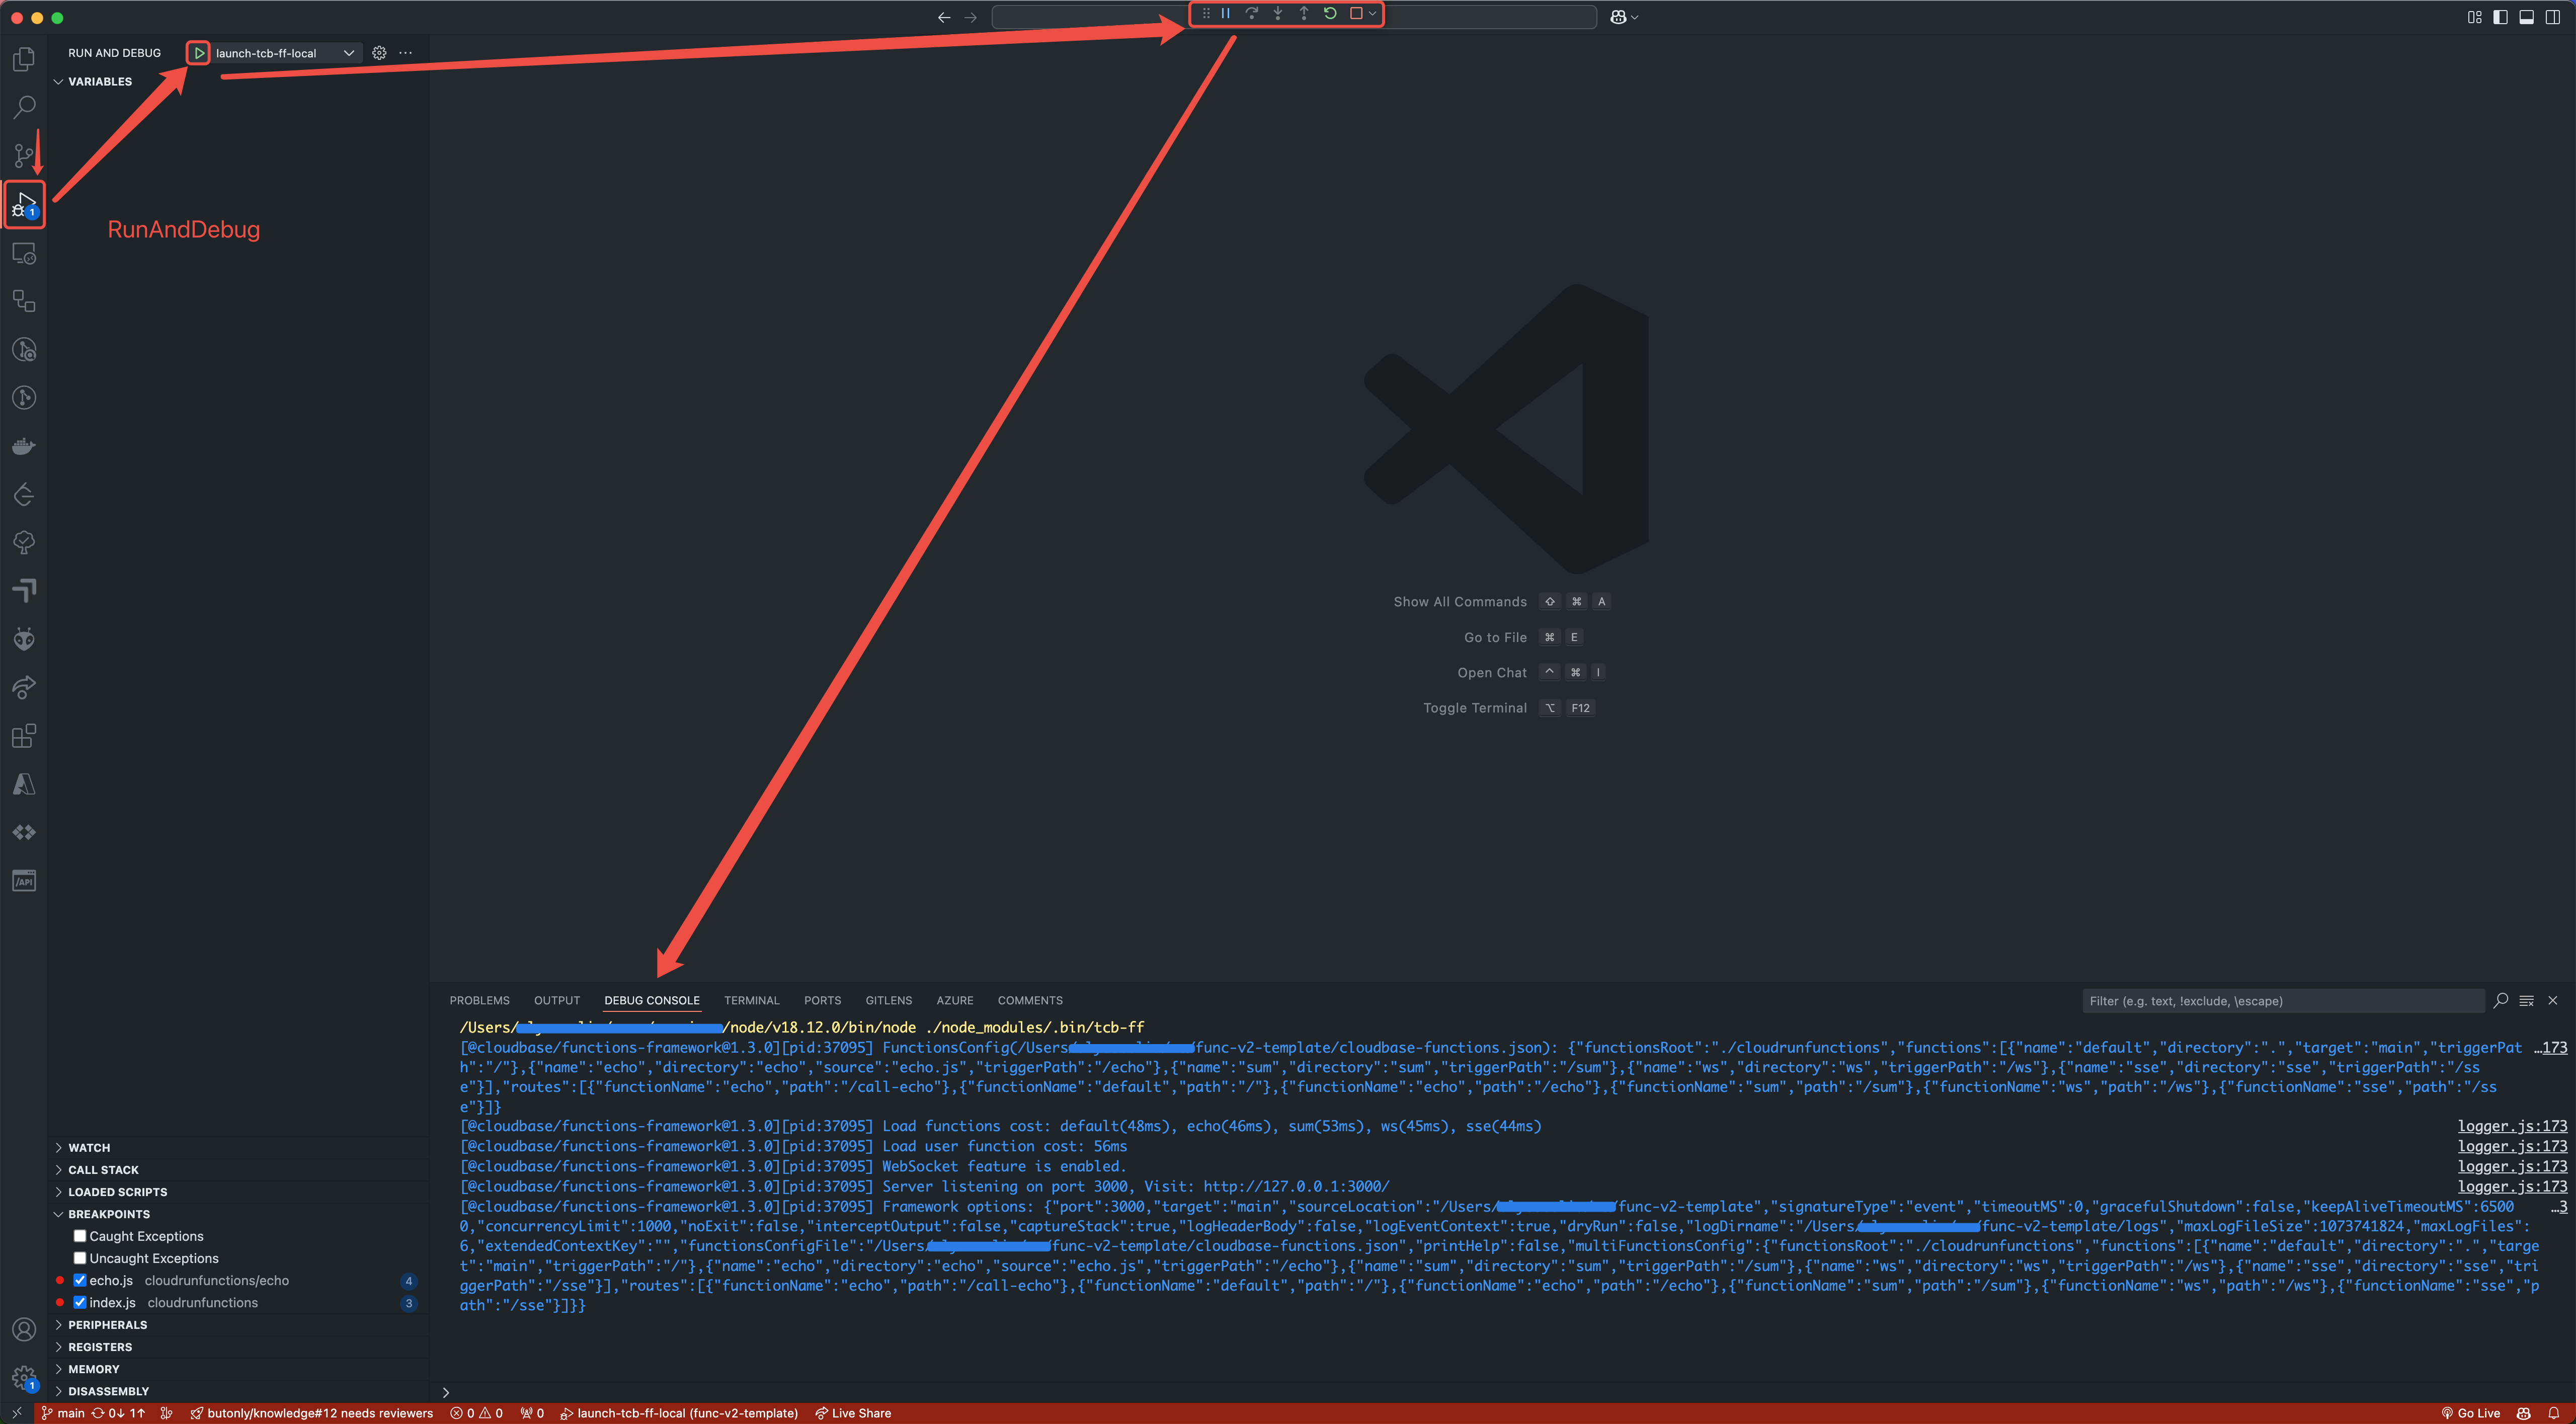
Start debugging according to the path shown in the figure below.
Set breakpoints and trigger function execution via curl invocation; the function will stop execution at the breakpoint:
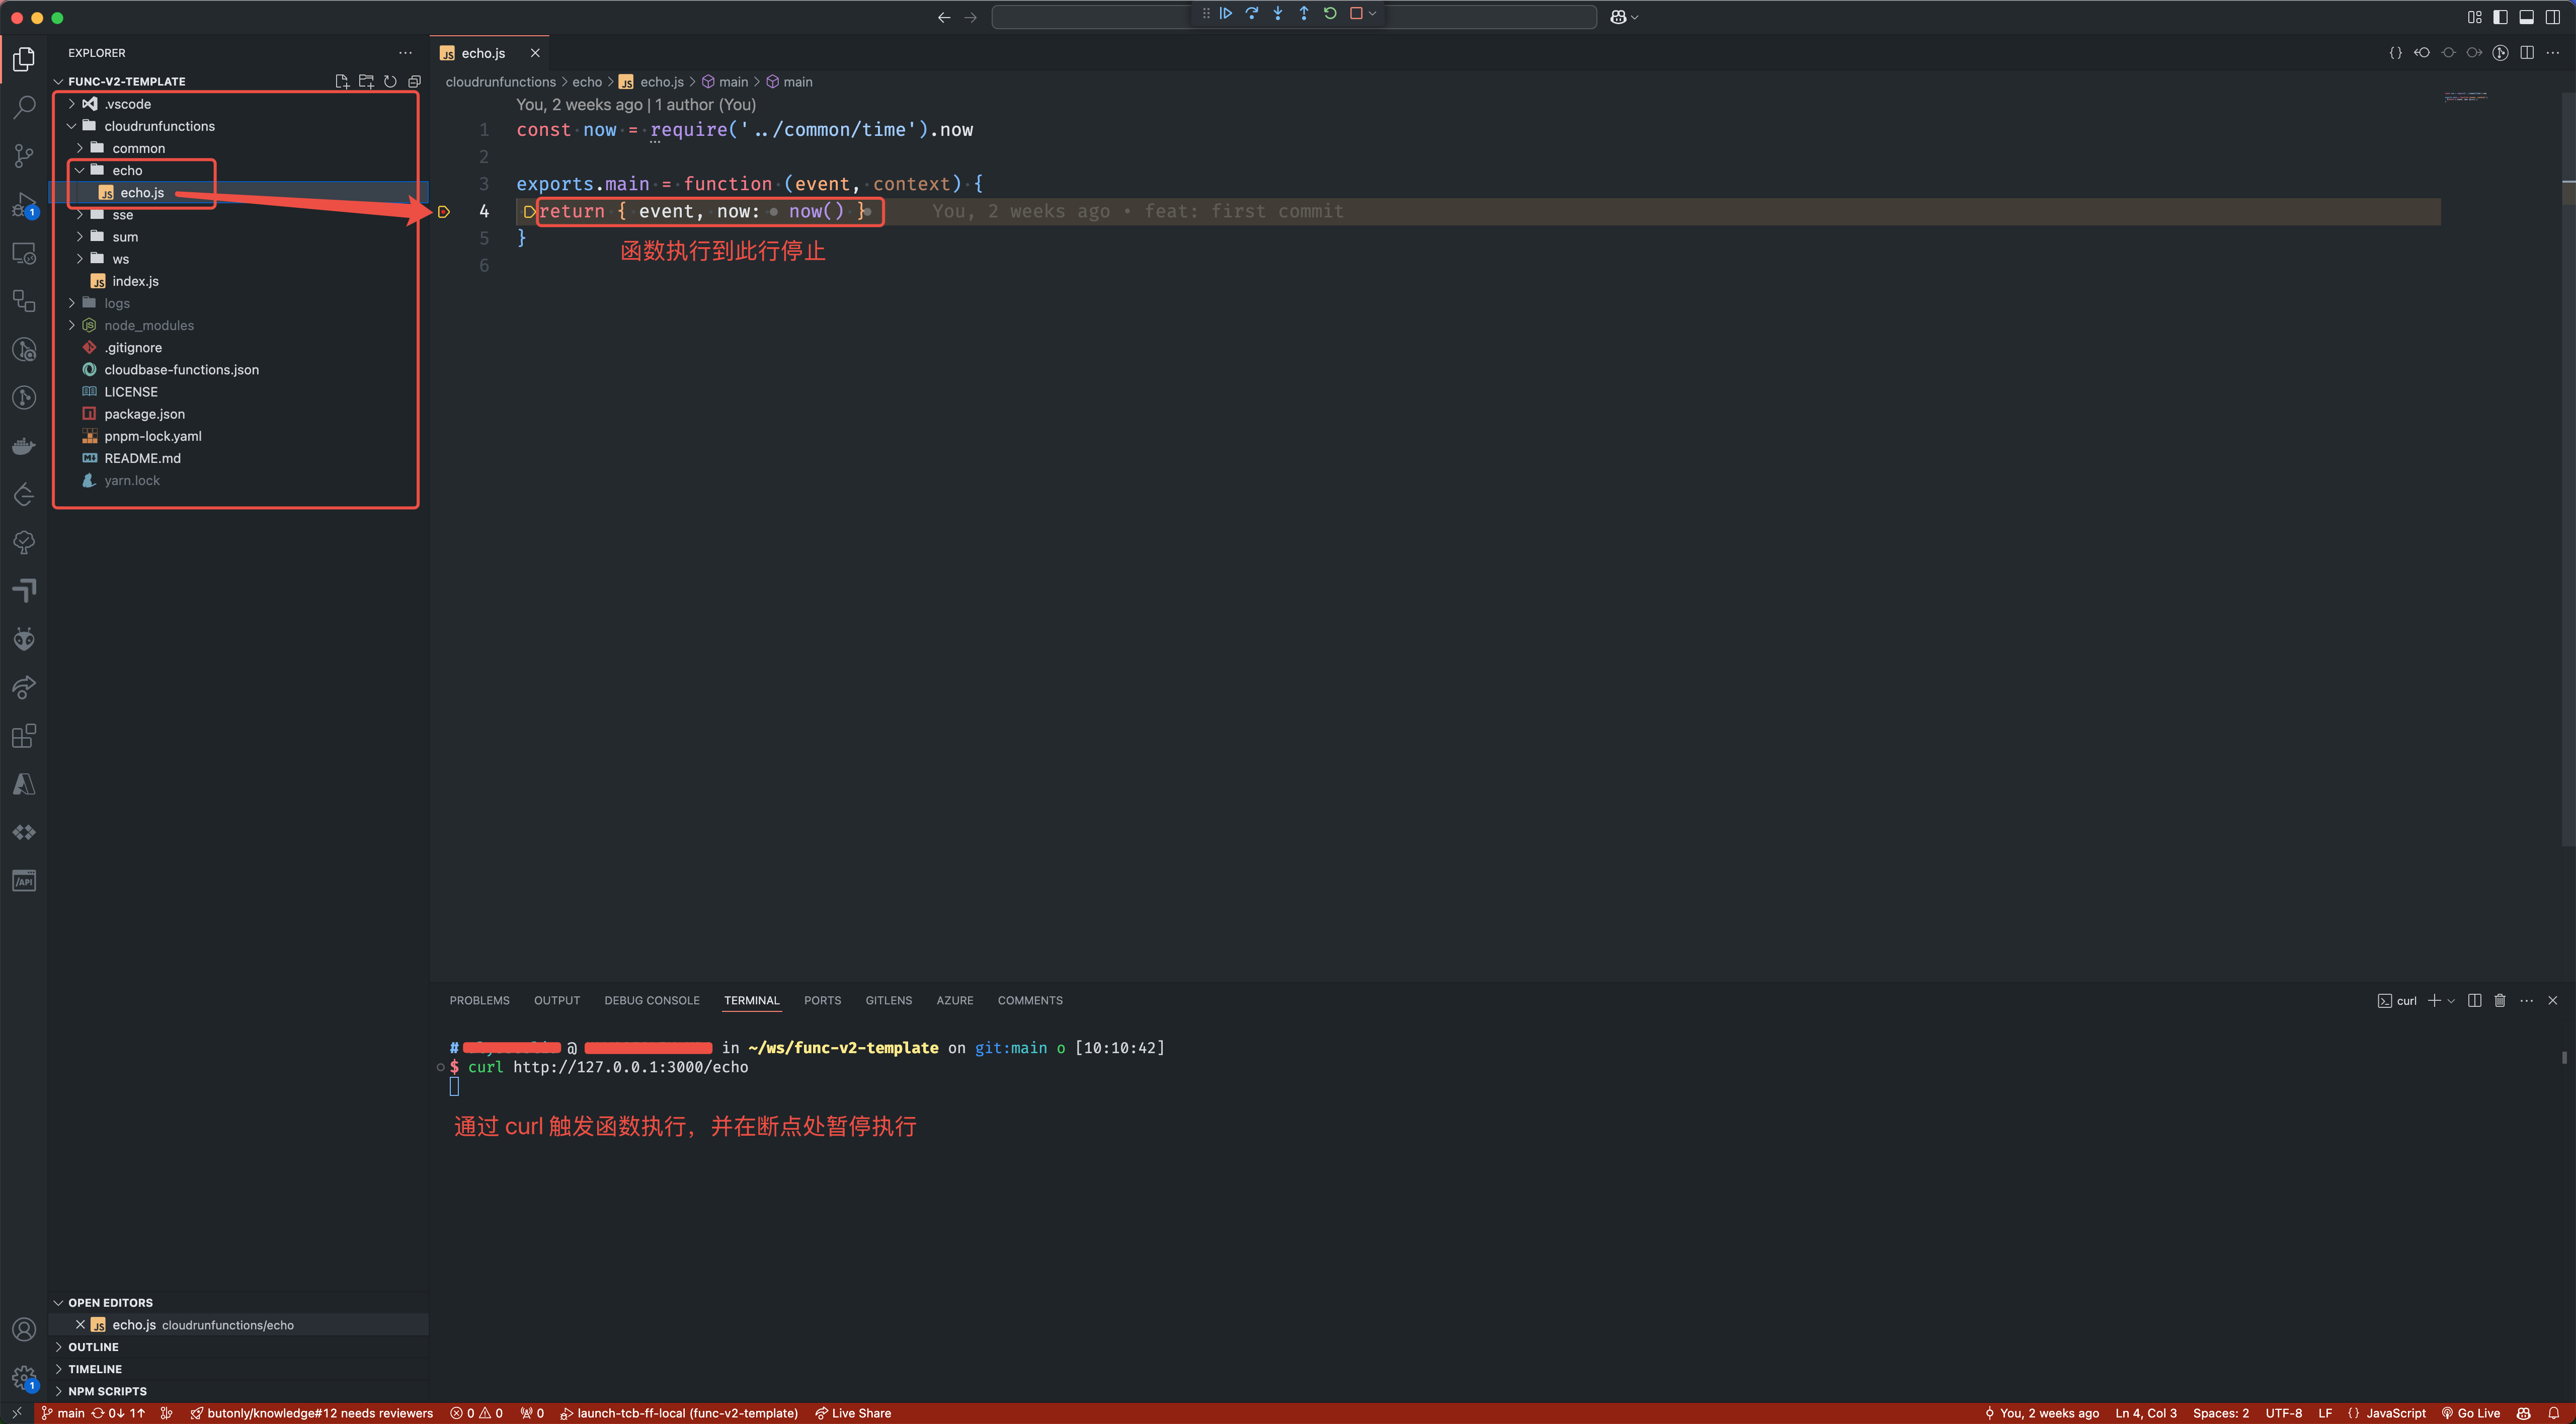
You can return to the RunAndDebug interface to view the current function stack information:
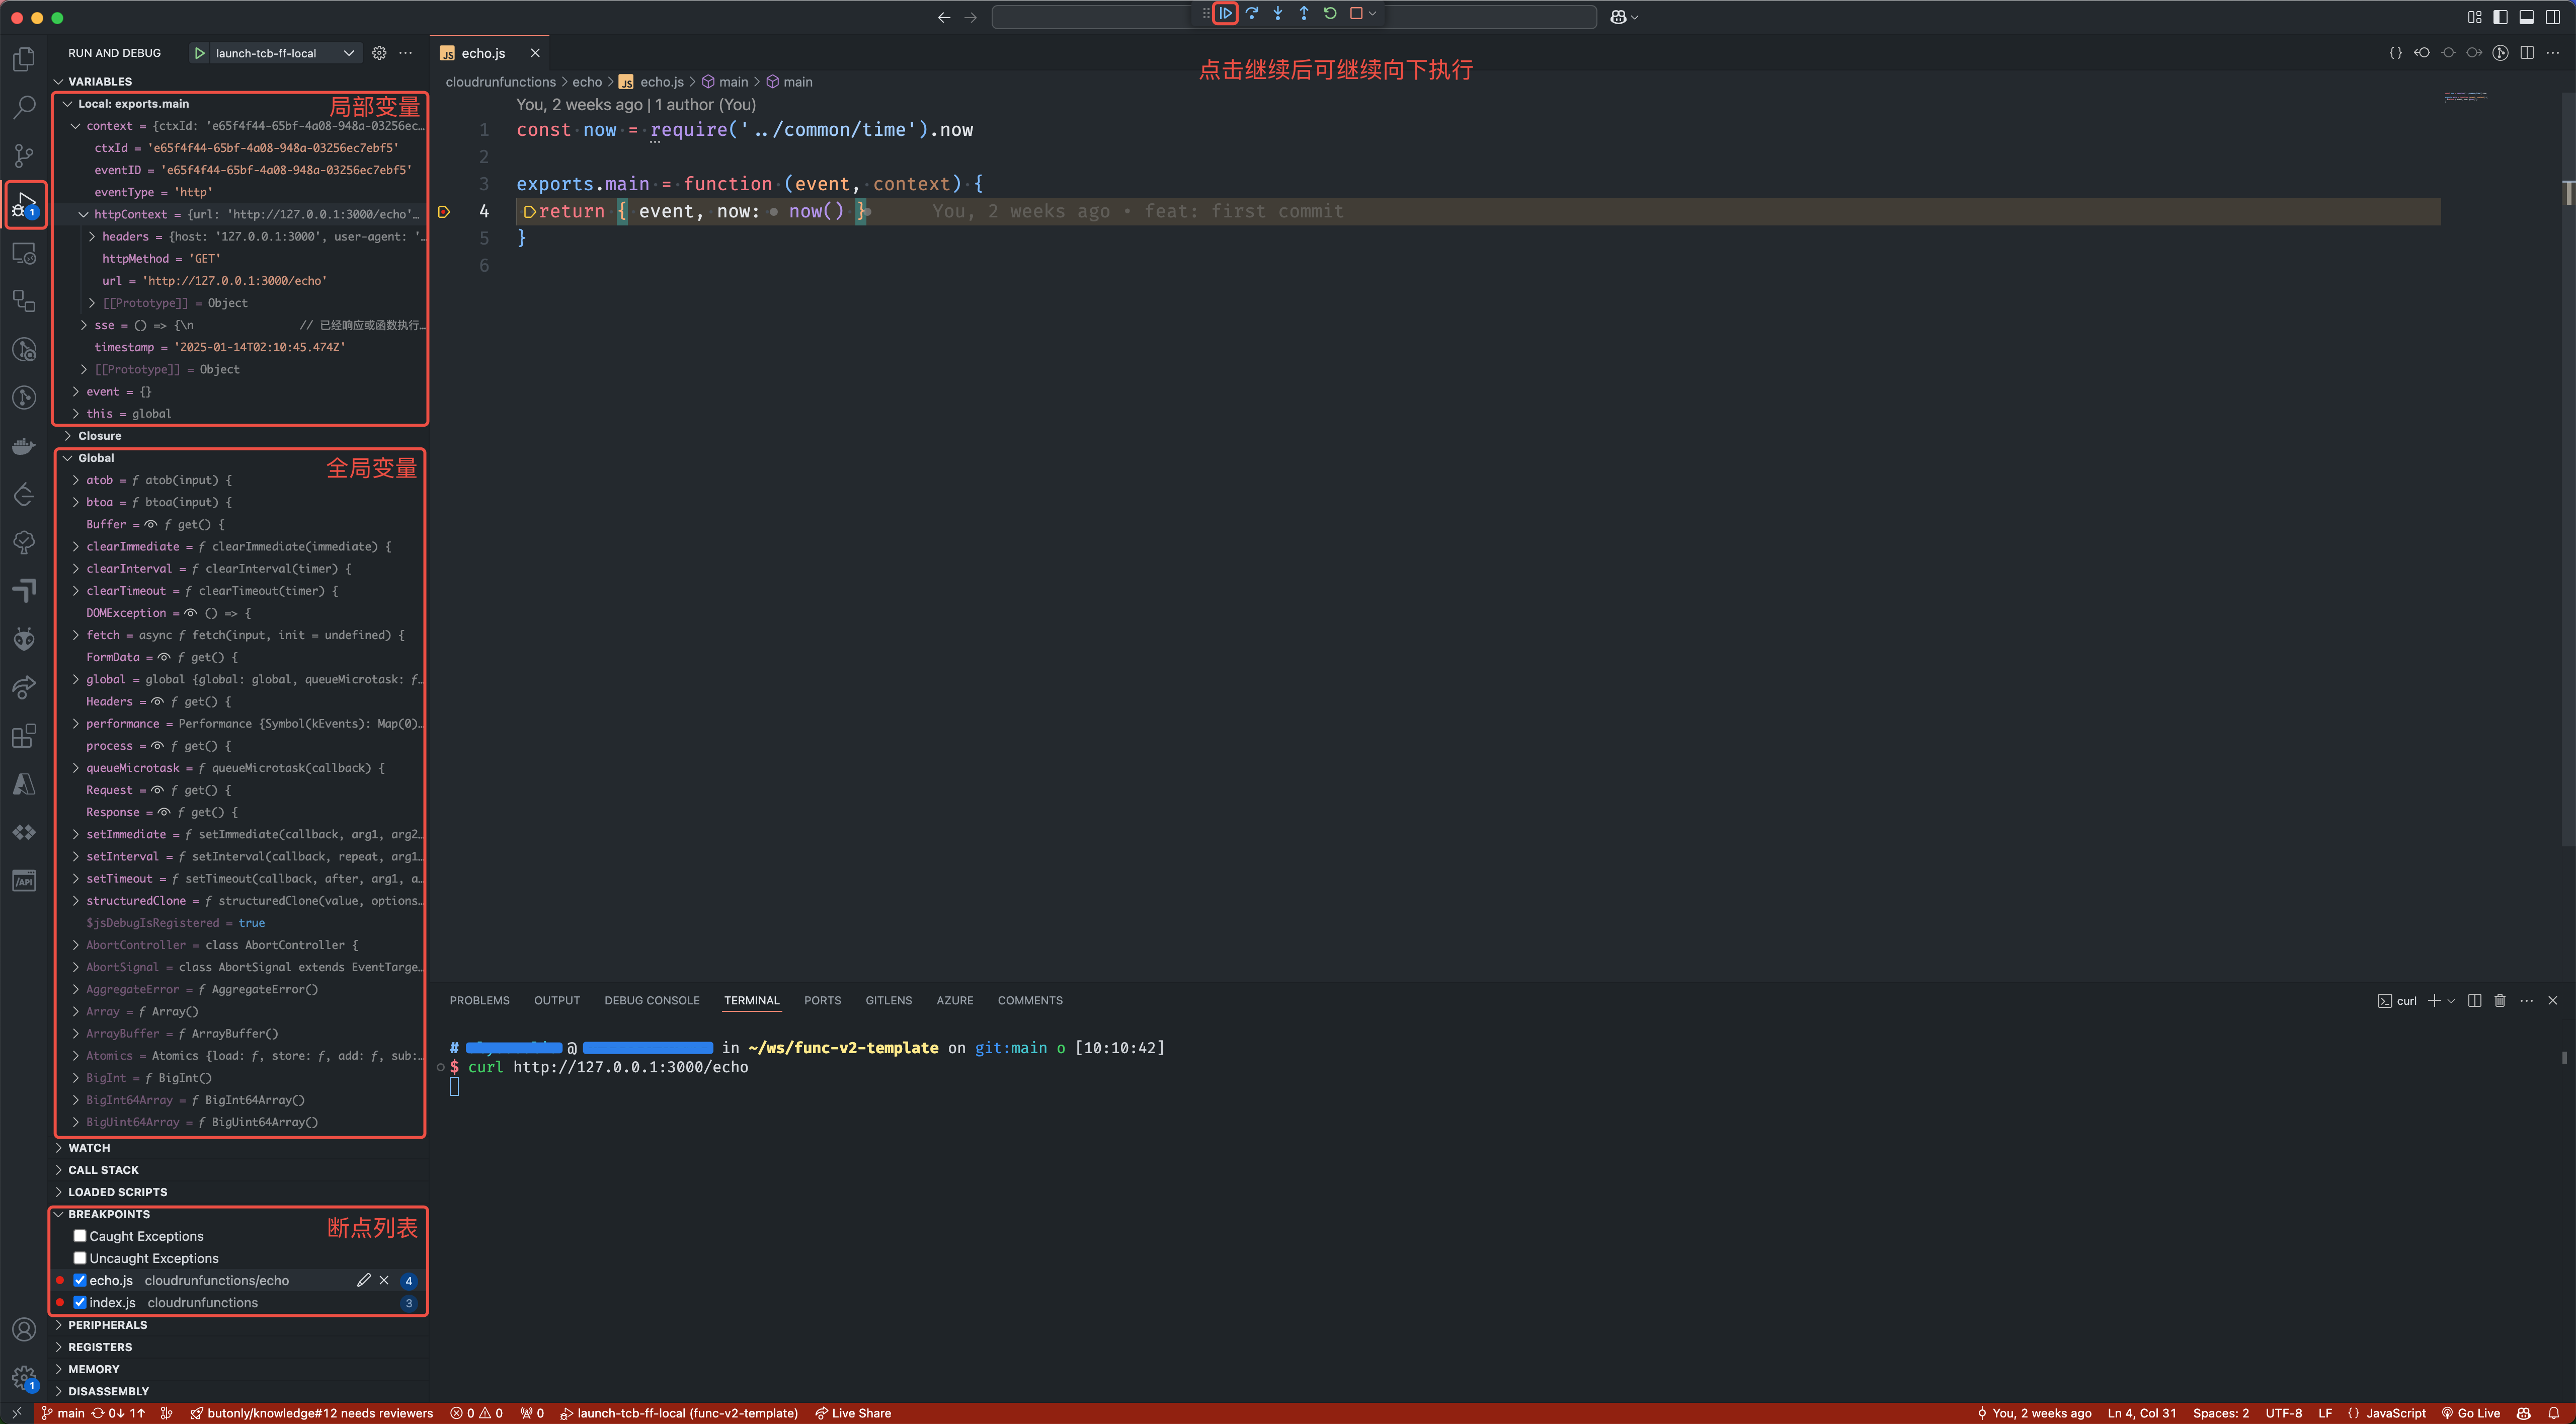
Click the Continue button in the Debug Control Panel, and the function will continue execution.