Cloud Function Debugging
Tencent CloudBase Toolkit has ceased maintenance and iteration. It is recommended to use the Cloud Development CLI tool.
Starting from version 0.2.0, the CloudBase Toolkit plugin supports two debugging modes for cloud functions: local debugging and cloud debugging.
- Local debugging: Use CloudBase CLI to simulate running Node.js cloud functions locally. The
eventandcontextof cloud functions are simulated parameters, suitable for local development. - Cloud debugging: Use cloud function instances in the cloud for debugging. All parameters and environments are consistent with the cloud, suitable for locating complex online issues.
Local Debugging
Local debugging requires the CloudBase CLI tool. Please install the CloudBase CLI tool first.
Operation Steps
- Ensure the
cloudbaserc.jsonconfiguration file exists in the current project root directory. If it does not exist, right-click in the resource management area and select [Generate cloudbaserc configuration file]. - Set breakpoints at the locations requiring debugging
- Select the cloud function directory to be debugged, right-click [Debug Cloud Function], and choose [Local Debugging] from the pop-up options.
Cloud Debugging
Cloud debugging runs a cloud function instance for debugging via local connection. Cloud debugging requires the use of a cloud function instance and will incur corresponding running costs.
Cloud debugging can only be triggered via the [Debug Cloud Function] option in CloudBase Toolkit and cannot be initiated through the Debug panel.
Operation Steps
Before starting the operation, it is recommended that you read the precautions.
It is not recommended to perform cloud debugging on production environments or frequently invoked cloud functions, as it may fail to hit breakpoints and block other requests. :::
Ensure the
cloudbaserc.jsonconfiguration file exists in the current project root directory. If it does not exist, right-click in the resource management area and select [Generate cloudbaserc configuration file].Select the cloud function directory to be debugged, right-click [Debug Cloud Function], and choose [Cloud Debugging] from the pop-up options.
Set breakpoints at the locations requiring debugging
Trigger your cloud function. You can trigger your cloud function based on your usage scenario from the Mini Program side, SDK, or Tencent Cloud console.
Notes
The cloud debugging capability for cloud functions is currently in the Beta stage. We welcome you to try it out and provide feedback on any issues or suggestions during use.
When using the cloud debugging capability for Cloud Functions, be aware of the following information and considerations:
- Cloud debugging uses an actual running concurrent instance of a cloud function for debugging.
- Due to the randomness of event triggering, when multiple instances exist, events may randomly land on any instance. Therefore, not every request can hit the debugging concurrent instance and initiate debugging.
- When debugging breakpoints are paused:
- Prolonged inactivity without response may cause the triggering end to report an error, such as the API Gateway indicating a timeout.
- The instance remains in a timed state and will continue execution until the function completes after debugging finishes. The total duration recorded throughout this process is counted as the function's execution duration.
- The maximum duration for a single execution, from triggering the concurrent instance to completing debugging, is 900 seconds. If execution is interrupted for more than 900 seconds during debugging, it will be forcibly terminated, and the function runtime will be recorded as 900 seconds with a timeout for statistics and metering.
- The debugging capability in the current version sets the cloud function timeout to 900 seconds. Upon normal exit from debugging, the timeout will be reset to the normal value. If the debugging command exits abnormally or is forcibly terminated, the cloud function timeout may fail to be set to the normal value. In this case, you can modify the cloud function's timeout configuration by redeploying (command line) or manually editing (console).
Configuration Item
Generally, you don't need to worry about debugging configuration options. CloudBase Toolkit will automatically generate relevant debugging configurations and launch the debugging functionality.
Local Debugging
Below is the launch configuration for local debugging, which includes the following options:
- type: VS Code debug type, fixed to node
- request: VS Code debug launch type, fixed to
attach - port: Debug process port, defaults to
9229 - name: The name of the current debugging item, defaults to
"[Function Name] Cloud Function Local Debugging" - entry: The target function name for debugging
- cloudbaseLocal: Indicates that the current debugging item is applicable to local debugging with CloudBase Toolkit
{
  "configurations": [
    {
      "type": "node",
      "request": "attach",
      "port": 9229,
      "name": "[app] Cloud Function Local Debugging",
      "entry": "app",
      "cloudbaseLocal": true
    }
  ]
}
Cloud Debugging
Below is the launch configuration for cloud debugging, which includes the following options:
- type: VS Code debug type, fixed to node
- request: VS Code debug launch type, fixed to
attach - port: Debug process port, defaults to
9222 - name: The name of the current debugging item, defaults to
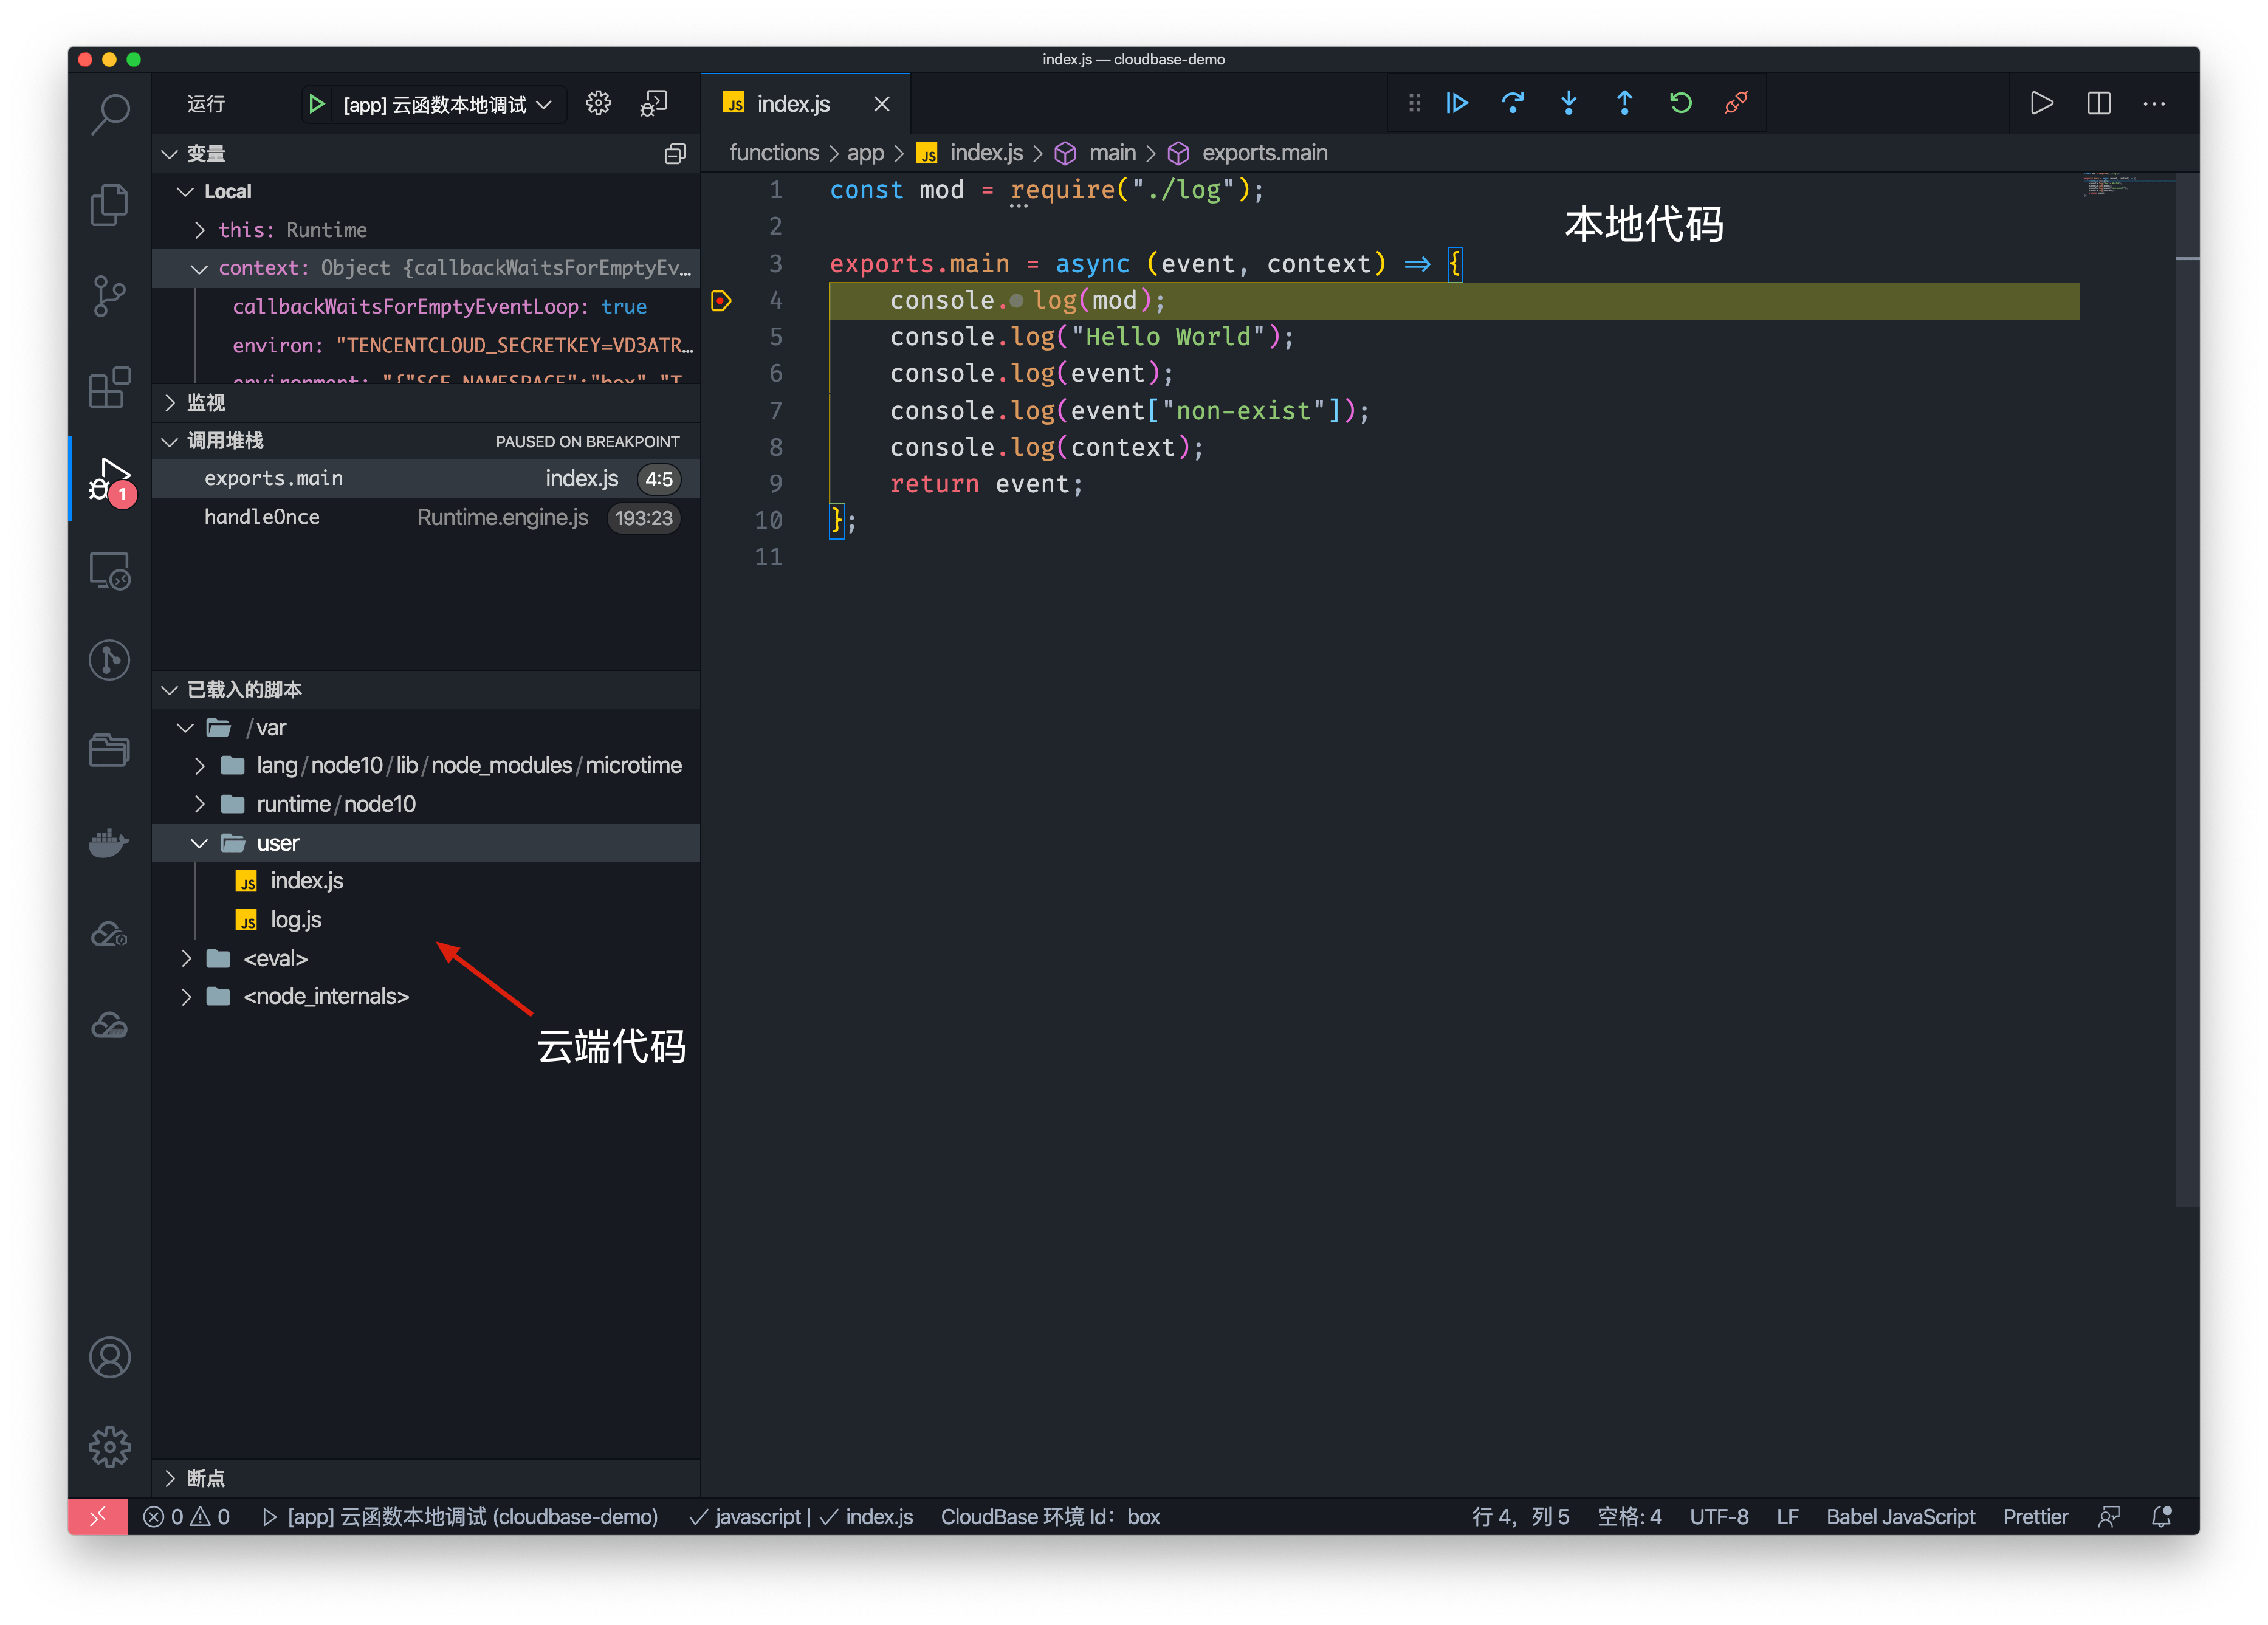
"[Function Name] Cloud Function Cloud Debugging" - remoteRoot: The root path of the cloud code, fixed to `/var/user
- localRoot: The root path of the local code
- cloudbaseRemote: Indicates that the current debugging item is the cloud debugging configuration item for CloudBase Toolkit
{
  "type": "node",
  "request": "attach",
  "name": "[app] Cloud Function Cloud Debugging",
  "port": 9222,
  "cloudbaseRemote": true,
  "remoteRoot": "/var/user",
  "localRoot": "${workspaceFolder}/functions/app"
}