Implementing Statistical Charts using Custom API
In WeDa, statistical components include bar charts, line charts, pie charts, and statistical cards. Besides achieving data statistical display using data sources, these components can also implement statistical display by processing data with custom APIs. This article will use custom APIs to process data in the sample data model and then implement the display of bar charts, line charts, pie charts, and statistical cards.
Example Data Model and Applications
Create a data model named "Statistical Sample Data" and add demo data through the backend Manage Data.
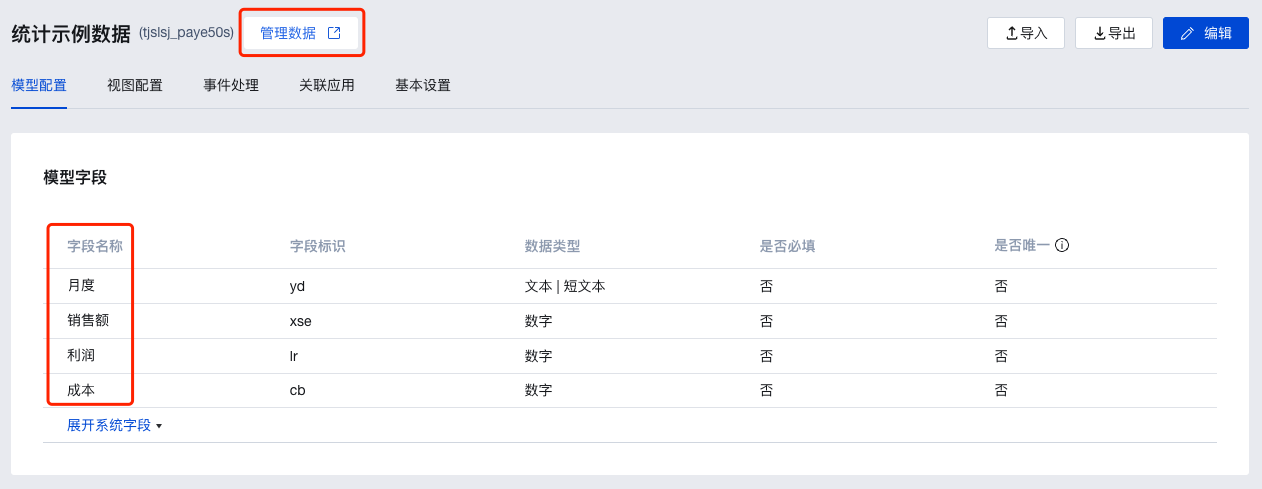 Here, 12 months of "sales", "profit", and "cost" demo data have been added.
 Create a sample app, then create a new page in the app to display statistical data.
Custom API and Methods
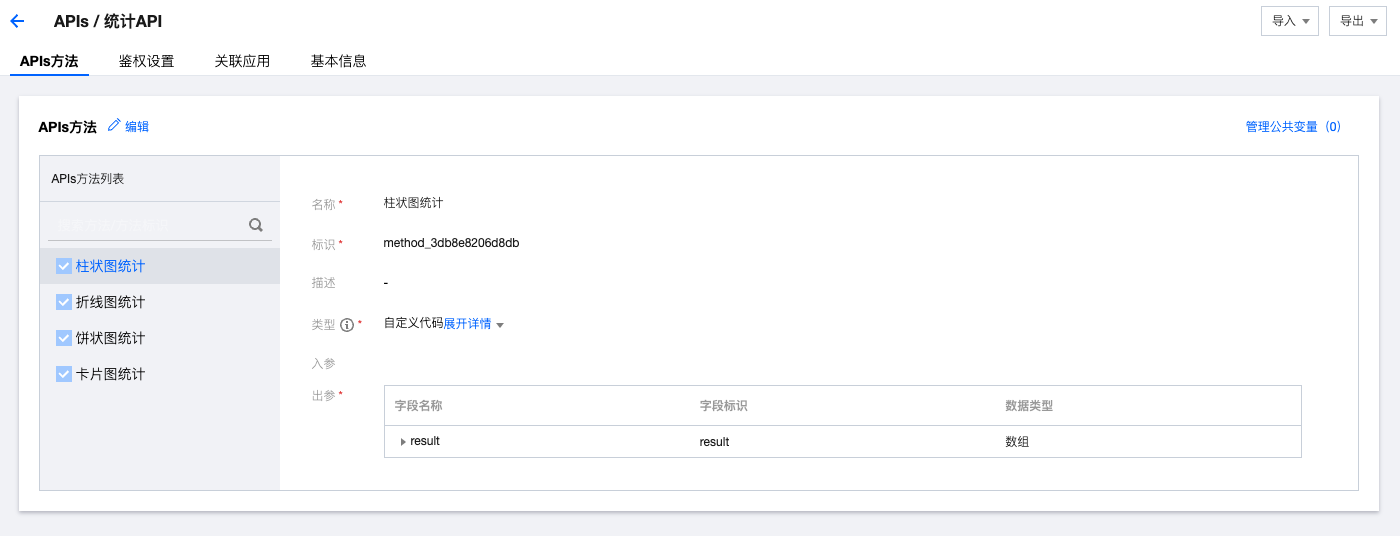
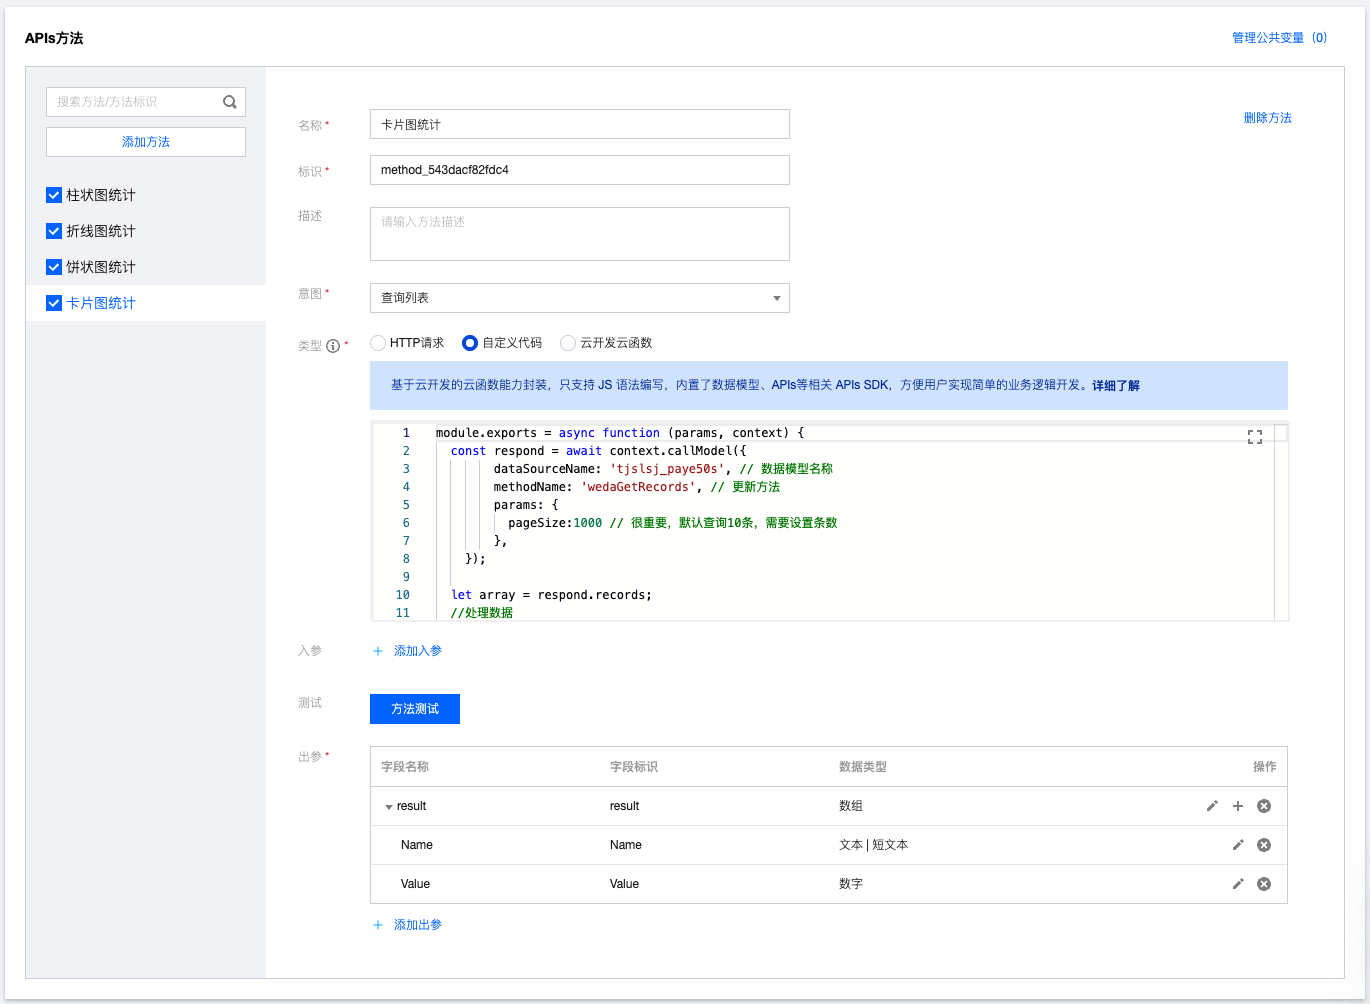
Create a custom API named "Statistical API", then add four API methods: bar chart statistics, line chart statistics, pie chart statistics, and card chart statistics.
Bar Chart Statistical Method
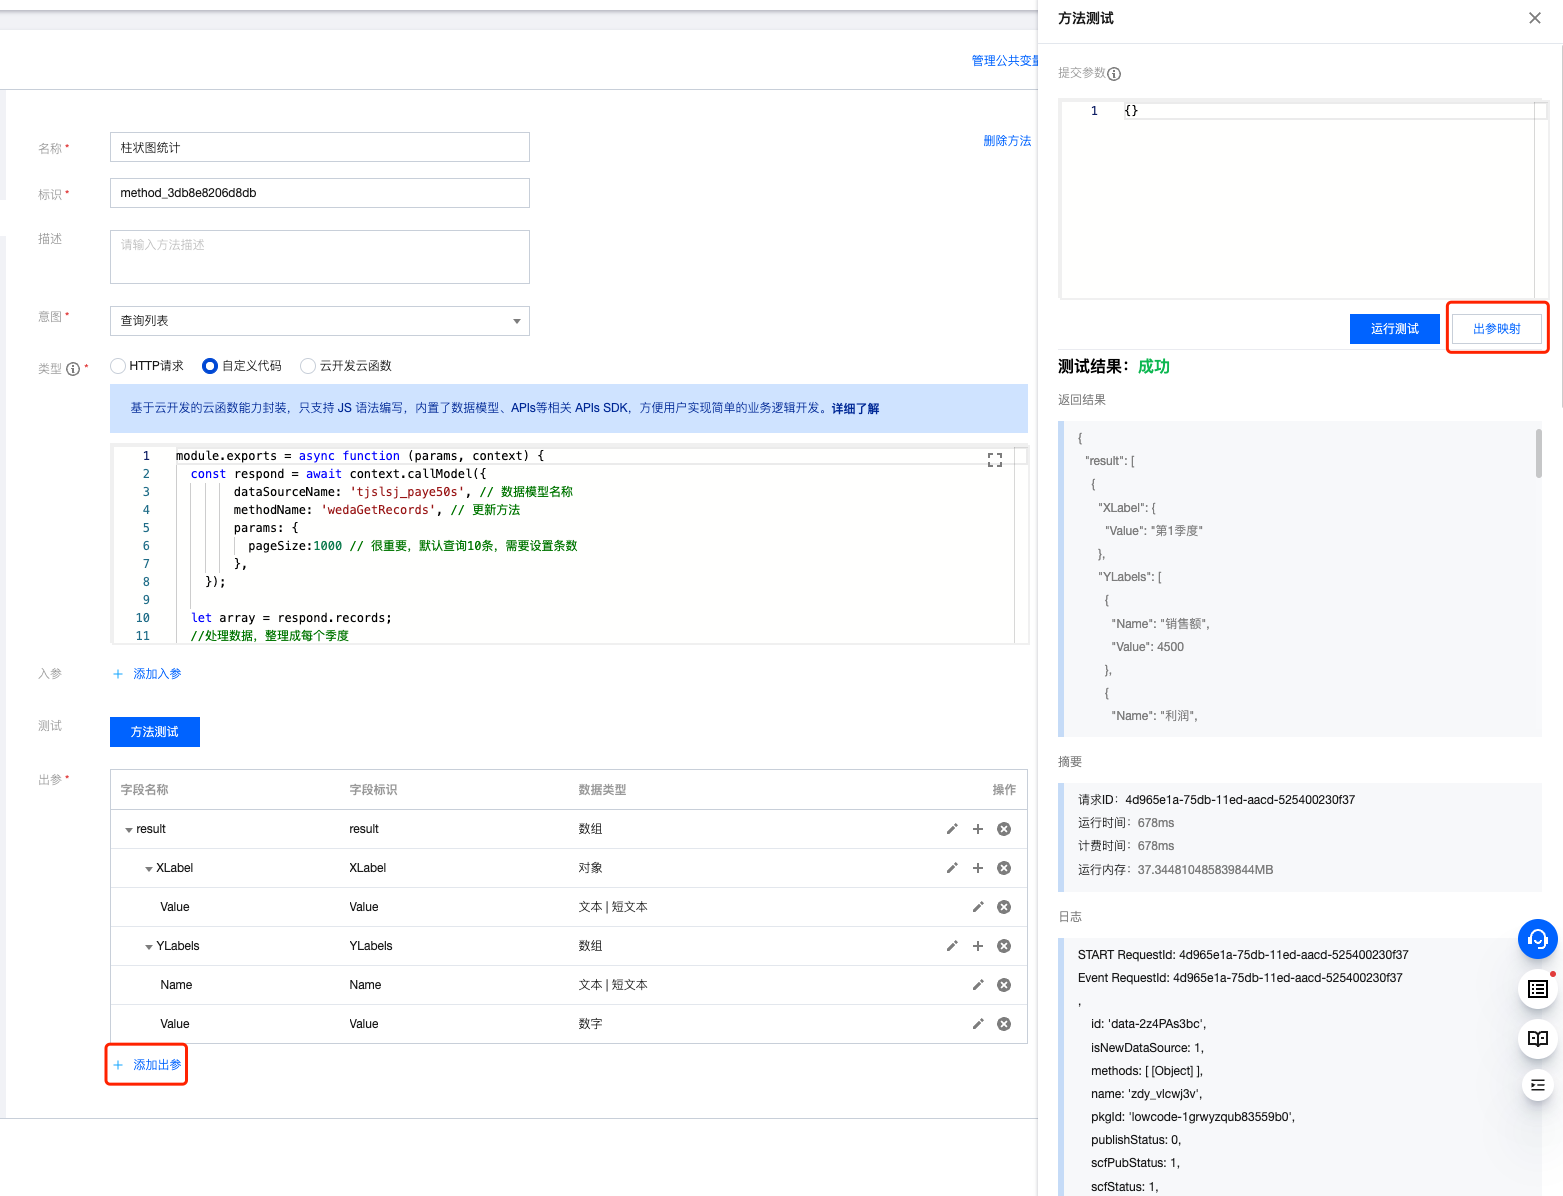
The function of the Bar Chart Statistical Method is primarily to query 12 months of data from the "Statistical Sample Data" data model, then calculate the "sales", "profit", and "cost" data for four quarters, and finally assemble it into the data format required by the bar chart.
 **The code is as follows:**
module.exports = async function (params, context) {
  const respond = await context.callModel({
    dataSourceName: "tjslsj_paye50s", // Data model name
    methodName: "wedaGetRecords", // update method
    params: {
      pageSize: 1000, // Important: The default query returns 10 items; set this value to change the number.
    },
  });

  let array = respond.records;
  // Process the data and organize by quarter
  jd_array = [];
  var xse = 0;
  var lr = 0;
  var cb = 0;
  for (var i = 0; i < array.length; i++) {
    if ((i + 1) % 3 != 0) {
      xse = xse + array[i].xse;
      lr = lr + array[i].lr;
      cb = cb + array[i].cb;
    } else {
      var name = "the " + ((i + 1) / 3).toString() + " quarter";
      xse = xse + array[i].xse;
      lr = lr + array[i].lr;
      cb = cb + array[i].cb;
      var v = { quarter: name, xse: xse, lr: lr, cb: cb };
      jd_array.push(v);
      xse = 0;
      lr = 0;
      cb = 0;
    }
  }

  // Construct the statistical format parameters
  let jsonData = [];
  jd_array.forEach((item) => {
    var v = {
      XLabel: { Value: item.quarter },
      YLabels: [
        { Name: "Sales", Value: item.xse },
        { Name: "Profit", Value: item.lr },
        { Name: "Cost", Value: item.cb },
      ],
    };
    jsonData.push(v);
  });
  return { result: jsonData };
};
Please note that the return parameter format of custom methods must be configured as required. Method output parameters can be configured using Add Output Parameters, or by running the test method in Method Testing, and then using Output Parameter Mapping for configuration after a successful test.
Line Chart Statistical Method
The function of the Line Chart Statistical Method is primarily to query 12 months of data from the "Statistical Sample Data" data model, and finally assemble it into the data format required by the line chart.
 **The code is as follows:**
module.exports = async function (params, context) {
  const respond = await context.callModel({
    dataSourceName: "tjslsj_paye50s", // Data model name
    methodName: "wedaGetRecords", // update method
    params: {
      pageSize: 1000, // Important: The default query returns 10 items; set this value to change the number.
    },
  });

  let array = respond.records;

  // Construct the statistical format parameters
  let jsonData = [];
  array.forEach((item) => {
    var v = {
      XLabel: { Value: item.yd },
      YLabels: [
        { Name: "Sales", Value: item.xse },
        { Name: "Profit", Value: item.lr },
        { Name: "Cost", Value: item.cb },
      ],
    };
    jsonData.push(v);
  });
  return { result: jsonData };
};
Pie Chart Statistical Method
The function of the Pie Chart Statistical Method is primarily to query 12 months of data from the "Statistical Sample Data" data model, then calculate the annual "Sales", "Profit", and "Cost" data, and finally assemble it into the data format required by the pie chart.
 **The code is as follows:**
module.exports = async function (params, context) {
  const respond = await context.callModel({
    dataSourceName: "tjslsj_paye50s", // Data model name
    methodName: "wedaGetRecords", // update method
    params: {
      pageSize: 1000, // Important: The default query returns 10 items; set this value to change the number.
    },
  });

  let array = respond.records;
  // Process data: calculate sales, profit, and cost for 12 months
  var total_xse = 0;
  var total_lr = 0;
  var total_cb = 0;
  array.forEach((item) => {
    total_xse = total_xse + item.xse;
    total_lr = total_lr + item.lr;
    total_cb = total_cb + item.cb;
  });

  // Construct the statistical format parameters
  let jsonData = [
    {
      XLabel: { Value: "Sales" },
      YLabels: [{ Name: "Amount", Value: total_xse }],
    },
    { XLabel: { Value: "Profit" }, YLabels: [{ Name: "Amount", Value: total_lr }] },
    { XLabel: { Value: "Cost" }, YLabels: [{ Name: "Amount", Value: total_cb }] },
  ];
  return { result: jsonData };
};
Card Chart Statistical Method
The function of the Card Chart Statistical Method is primarily to query 12 months of data from the "Statistical Sample Data" data model, then calculate the annual "Sales" data, and finally assemble it into the data format required by the card chart.
The code is as follows:
module.exports = async function (params, context) {
  const respond = await context.callModel({
    dataSourceName: "tjslsj_paye50s", // Data model name
    methodName: "wedaGetRecords", // update method
    params: {
      pageSize: 1000, // Important: The default query returns 10 items; set this value to change the number.
    },
  });

  let array = respond.records;
  // Process data
  // Process data: calculate sales for 12 months
  var total_xse = 0;

  array.forEach((item) => {
    total_xse = total_xse + item.xse;
  });
  // Assemble statistical format
  let jsonData = [{ Name: "Sales", Value: total_xse }];

  return { result: jsonData };
};
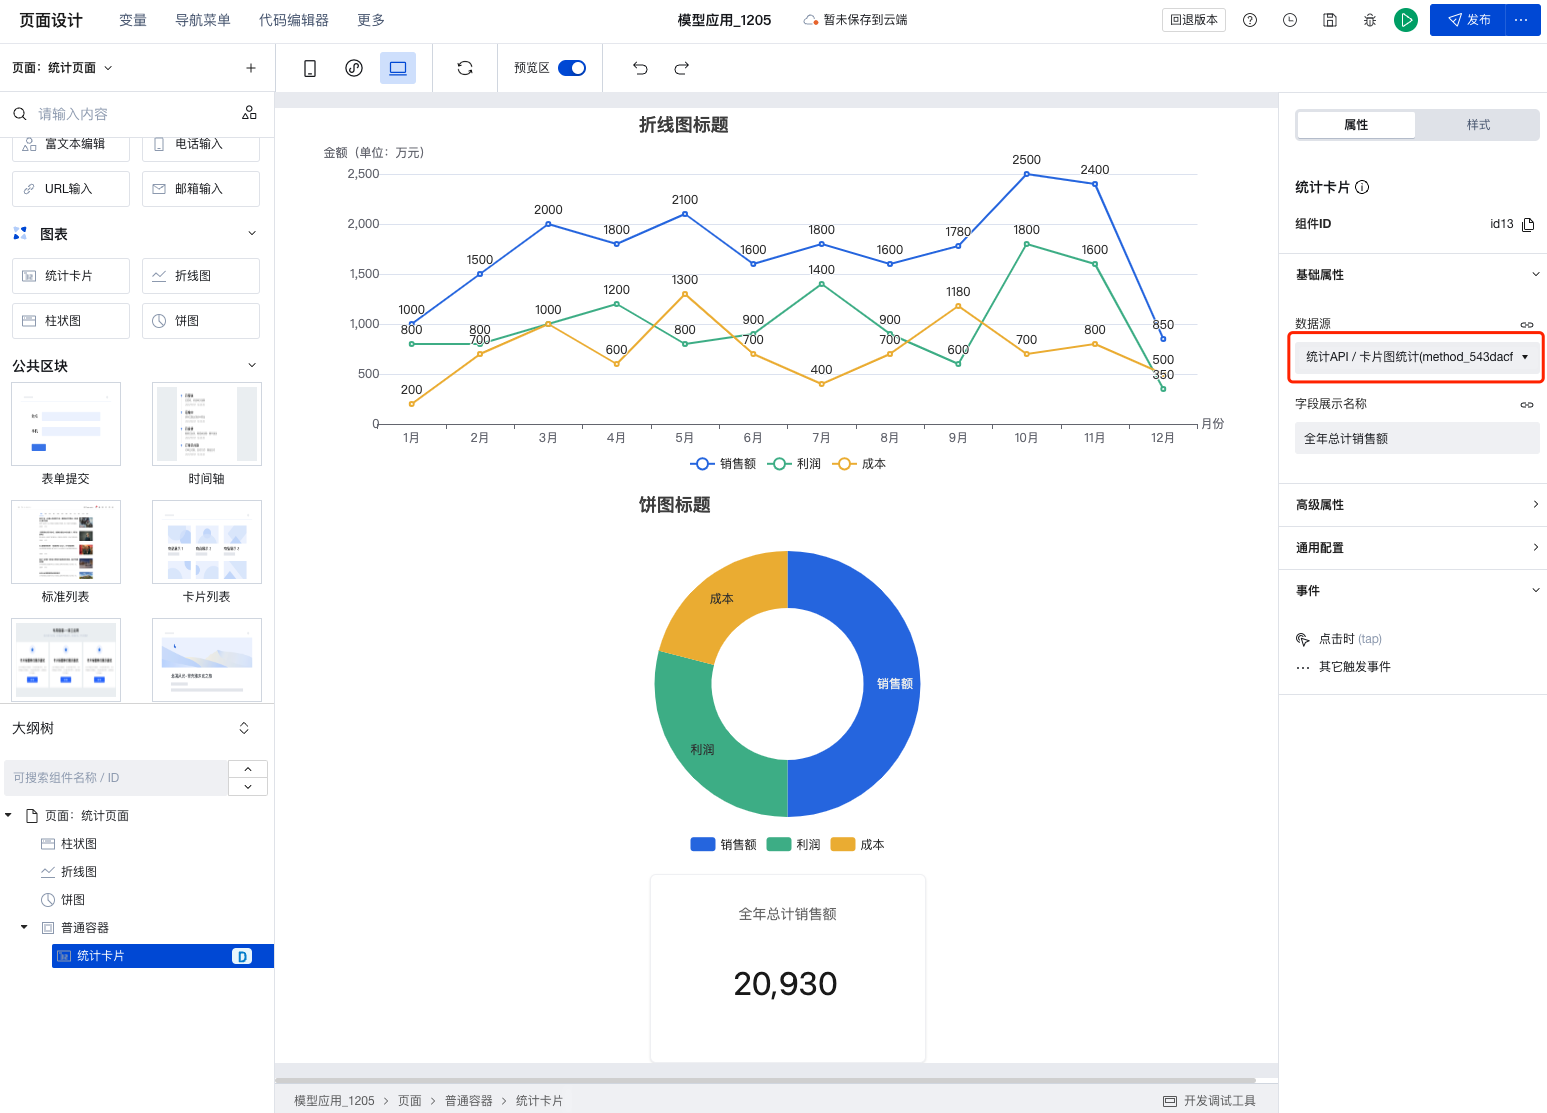
Statistical Chart Display Configuration
On the statistics page, add bar chart, line chart, pie chart, and statistical card components respectively, then configure the data source in the properties of each component.
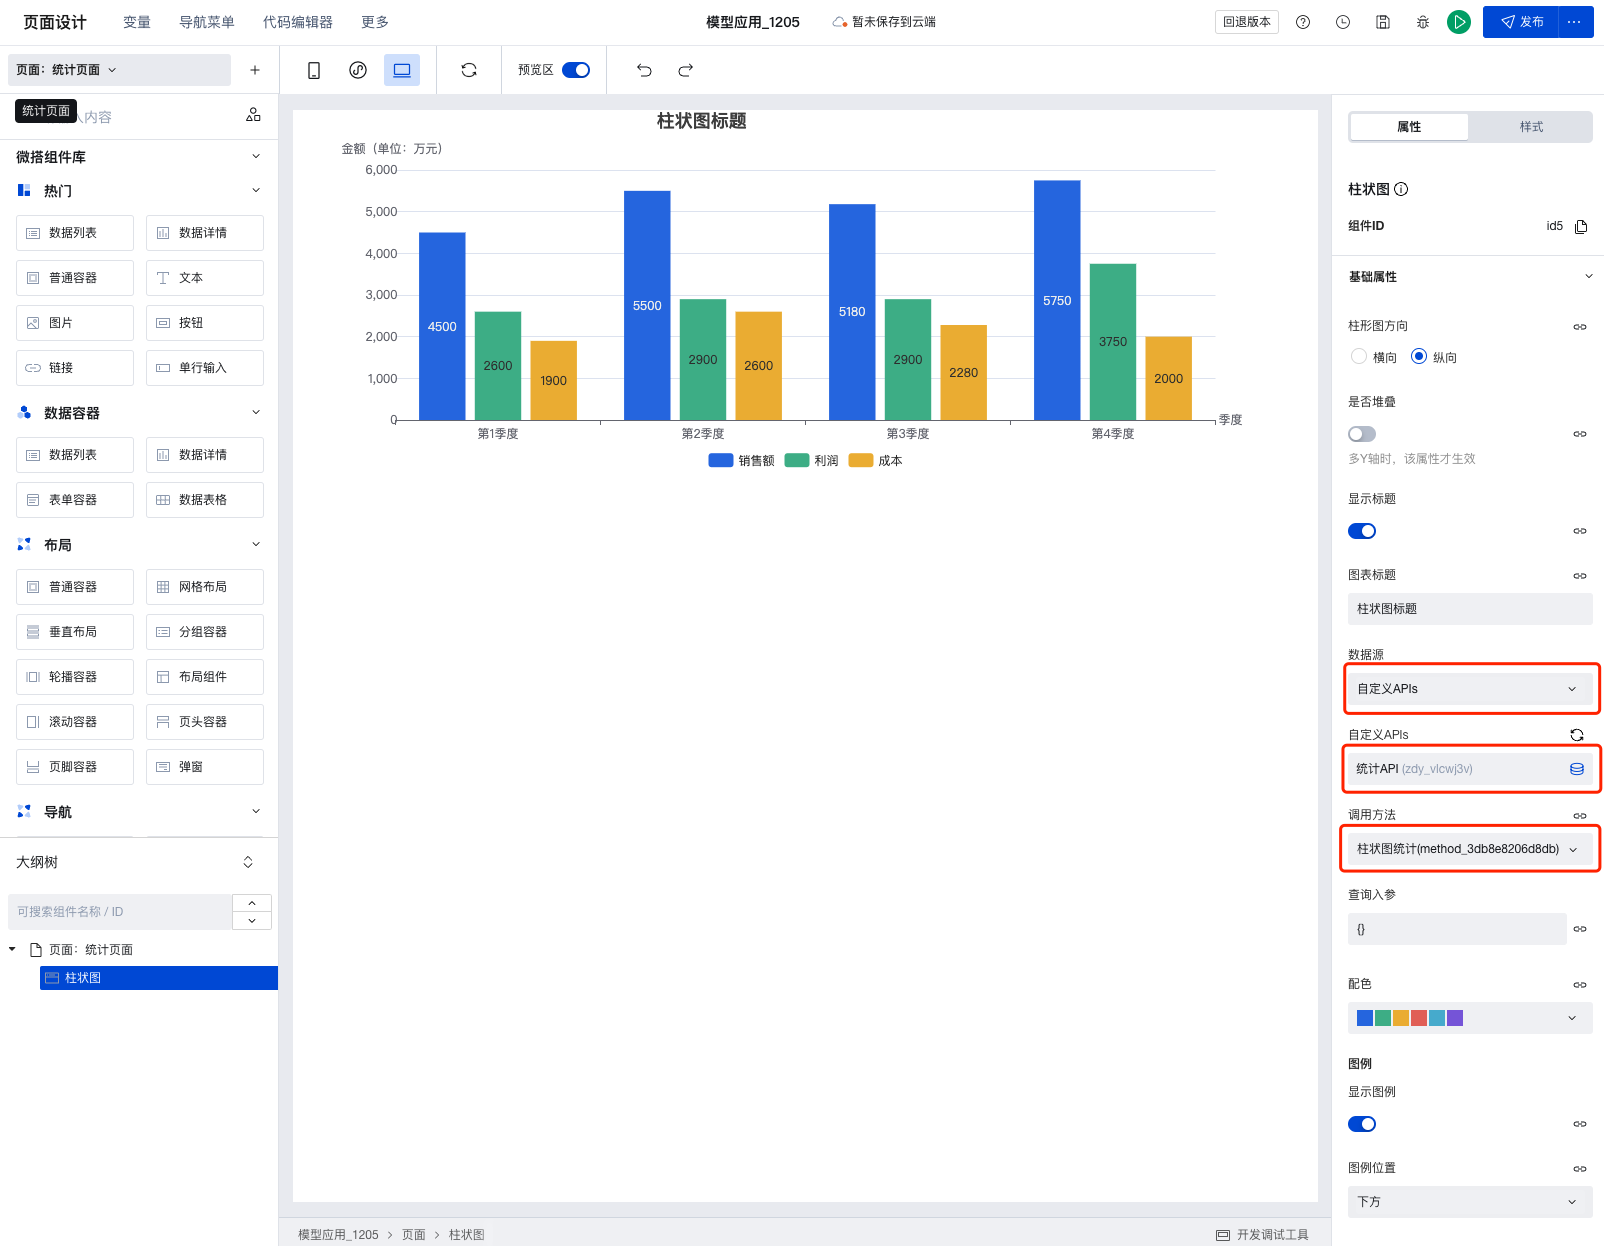
Bar Chart Configuration
Drag the bar chart component, in the properties area select Custom APIs for Data Source, for Custom APIs select Statistics API, for Call Method select Bar Chart Statistics, and set other properties as needed.
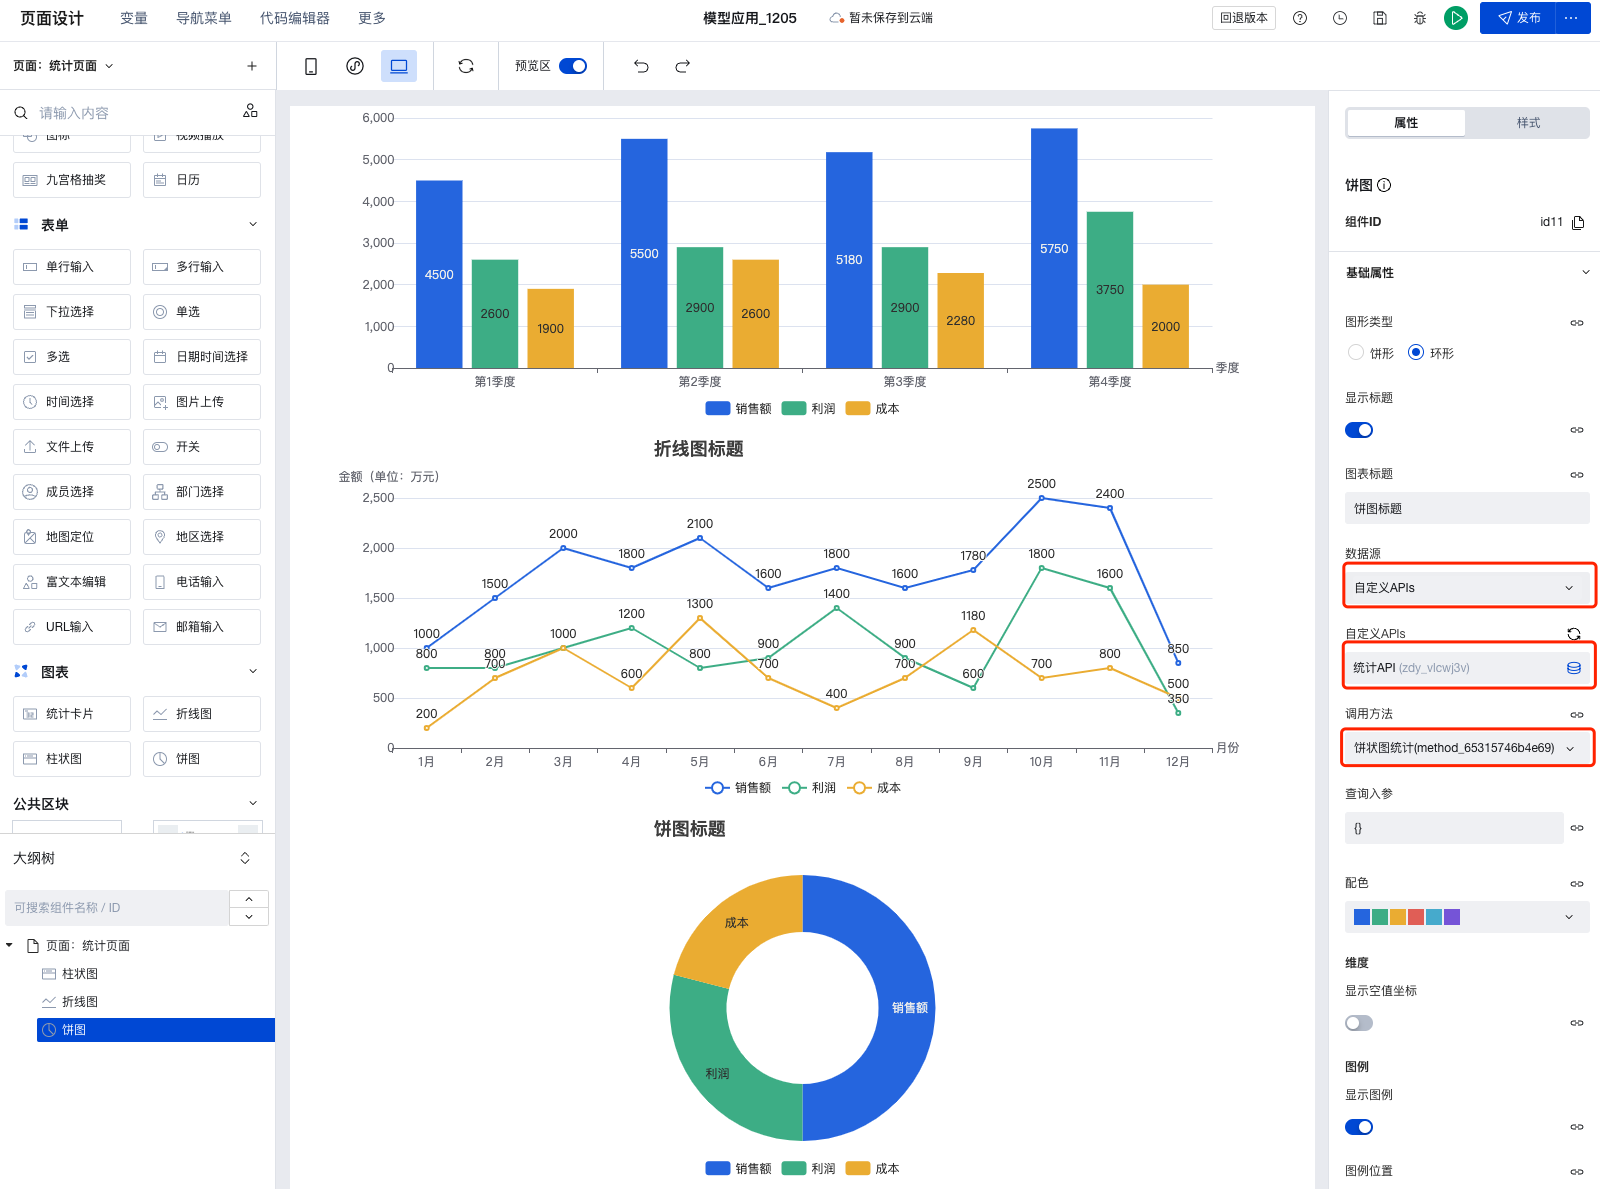
Line Chart Configuration
Drag the line chart component, in the properties area select Custom APIs for Data Source, for Custom APIs select Statistics API, for Call Method select Line Chart Statistics, and set other properties as needed.

Pie Chart Configuration
Drag the pie chart component, in the properties area select Custom APIs for Data Source, for Custom APIs select Statistics API, for Call Method select Pie Chart Statistics, and set other properties as needed.
Card Configuration
Drag the statistical card component, in the properties area select "Statistics API or Card Statistics" for Data Source, and set other properties as needed.