API Online Debugging
Introduction to API Debugging Tool
The Cloud Development Platform provides an online debugging tool that allows developers to test API interfaces without writing any code. This tool is highly useful for quickly validating API requests and viewing responses.
Access Debugging Interface
Open HTTP API Documentation Page
We have directly integrated a debugging tool into the HTTP API documentation page, allowing direct invocation. For example, the User Authentication/Sign In By Email/Phone/Username interface can be tested online.
Locate Debugging Tool
In the management interface, locate the entry point for the API debugging tool, typically positioned on the right side of the documentation.
Send Request
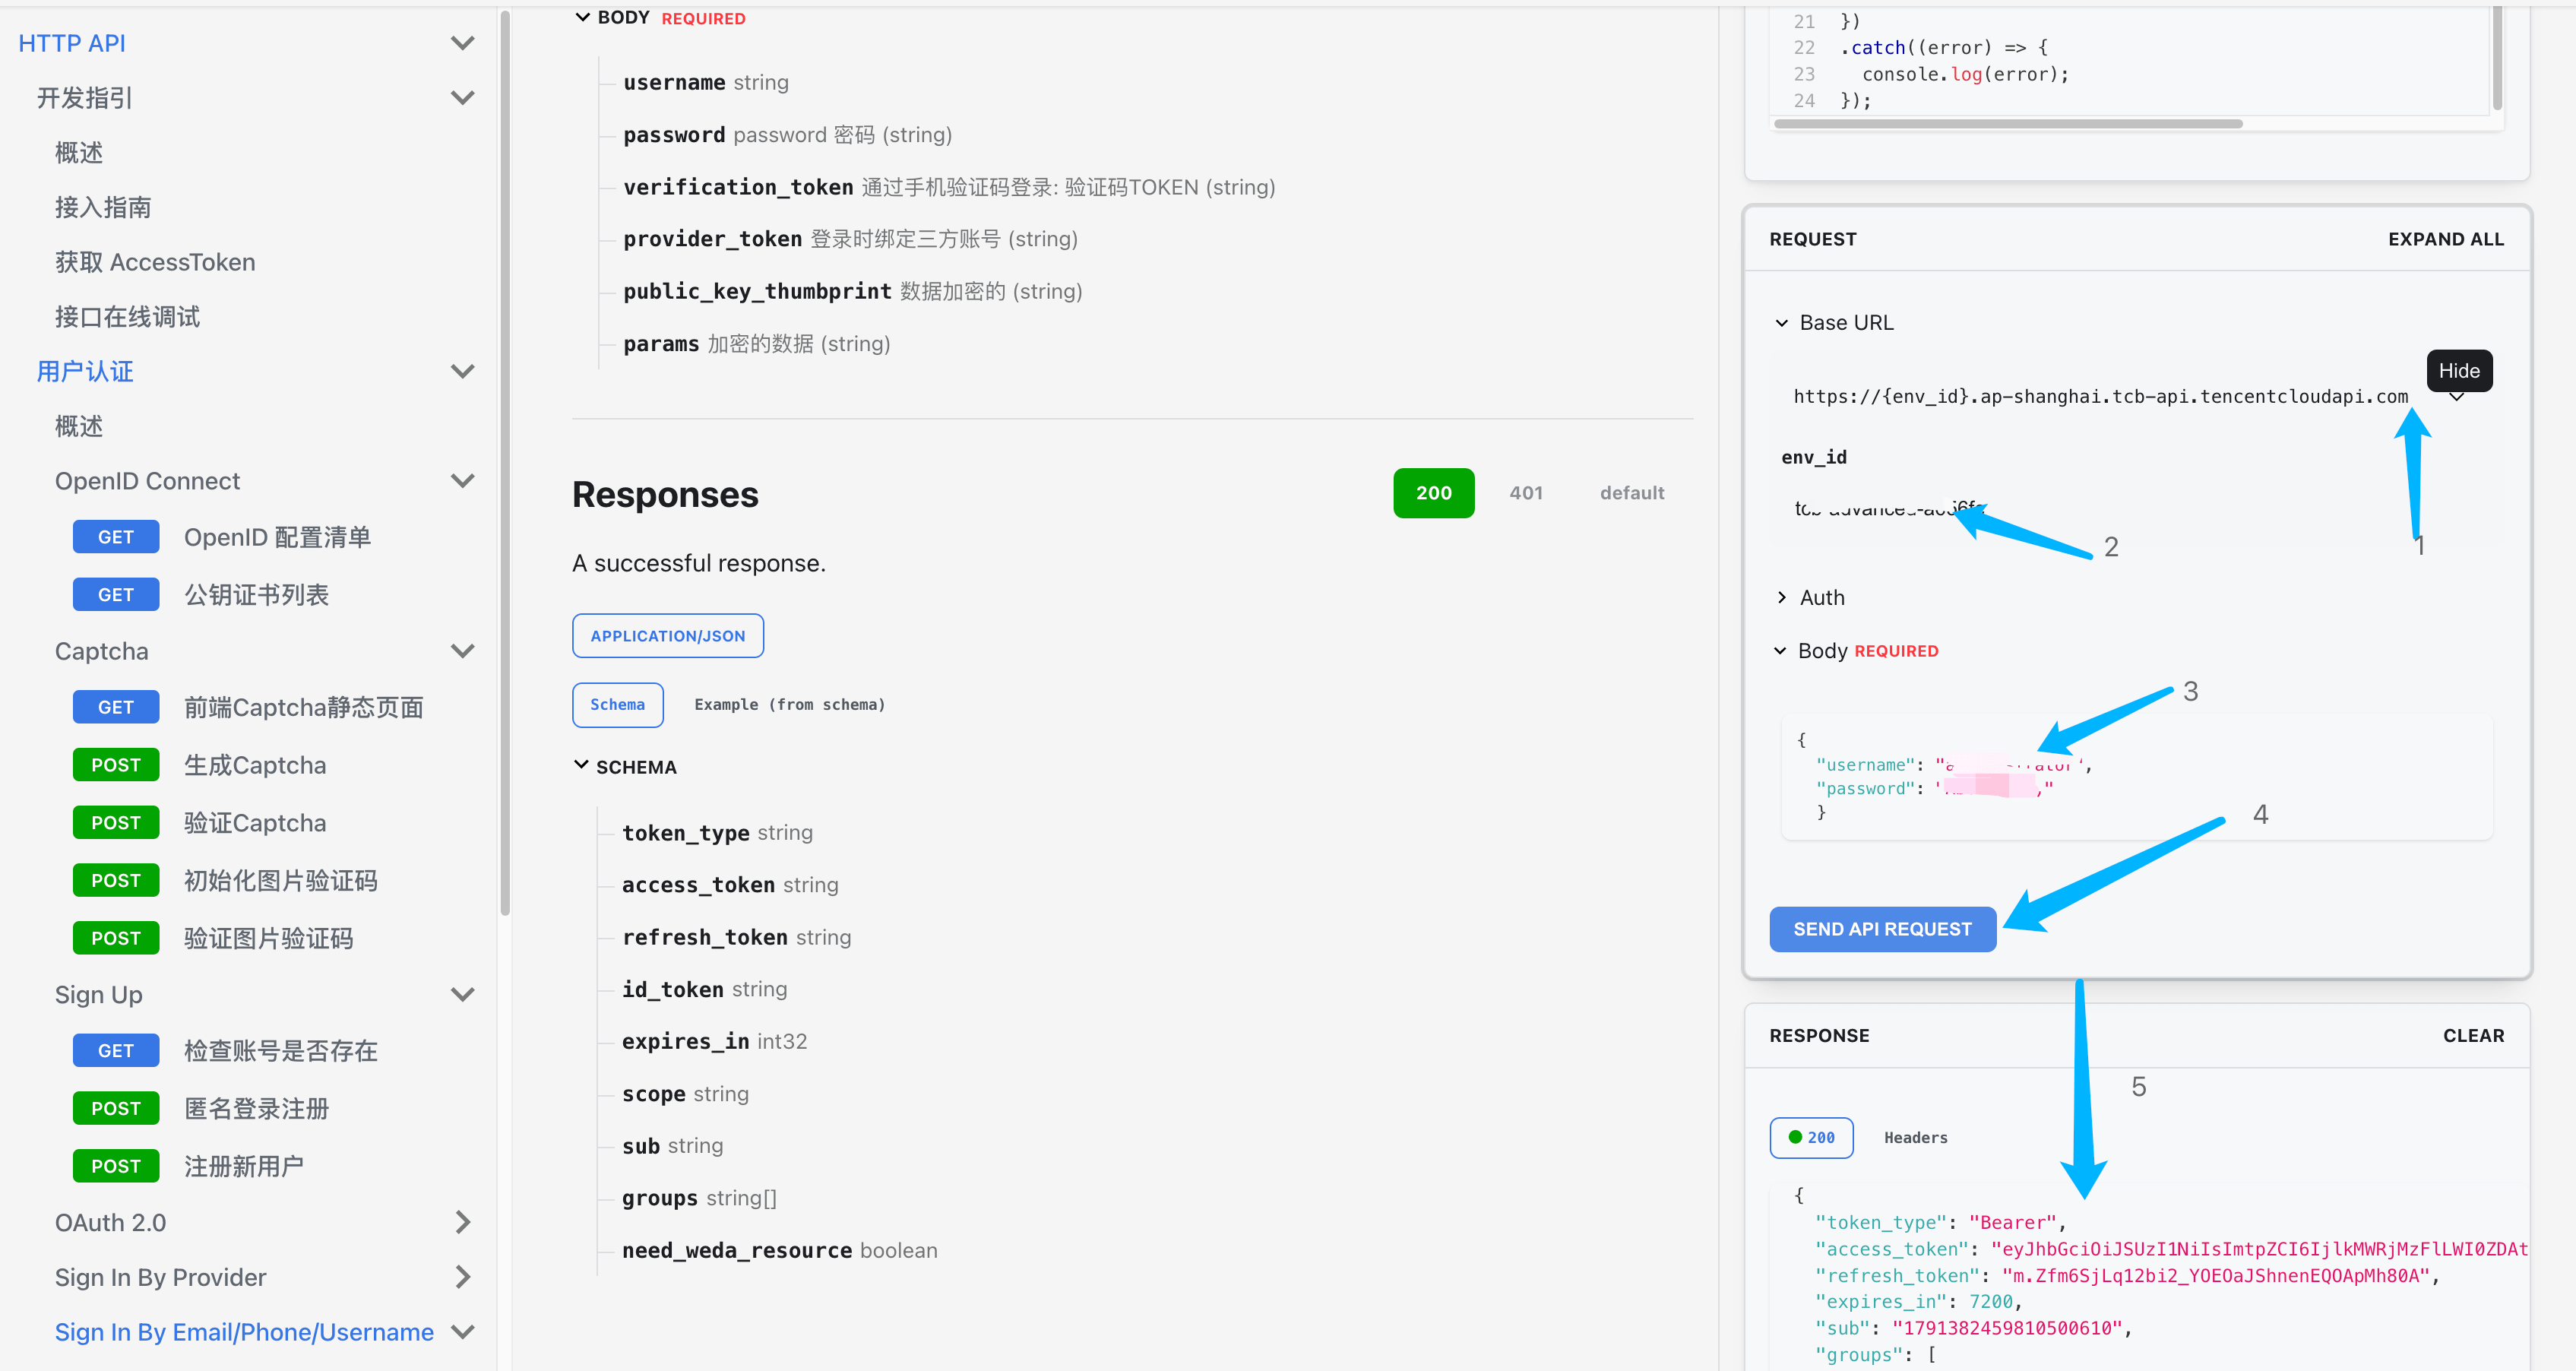
-
- Click Edit on the API address
-
- Enter env_id: fill in your CloudBase environment id
-
- Enter parameters in the body
-
- Click SEND API REQUEST to send the request
-
- View the RESPONSE interface response
Select API Interface
In the debugging tool, select the API interface you want to test.
Configure Request Parameters
Based on the requirements of the selected API, fill in the necessary request parameters. This may include path parameters, query parameters, request headers, and the request body.
- Enter env_id: fill in your CloudBase environment id
- Enter parameters in the body
Send Request
Click the "SEND API REQUEST" button, and your request will be sent to the server, allowing you to view the response immediately.
View and Analyze Response
The RESPONSE panel will display the interface response.
Check Response Status Code
Check the HTTP status code of the response to determine whether the request was successful.
Analyze Response Body
View the data in the response body and analyze whether the returned information meets expectations.
Debug Information
If the request fails, check the error messages and documentation to help diagnose the issue.
Notes
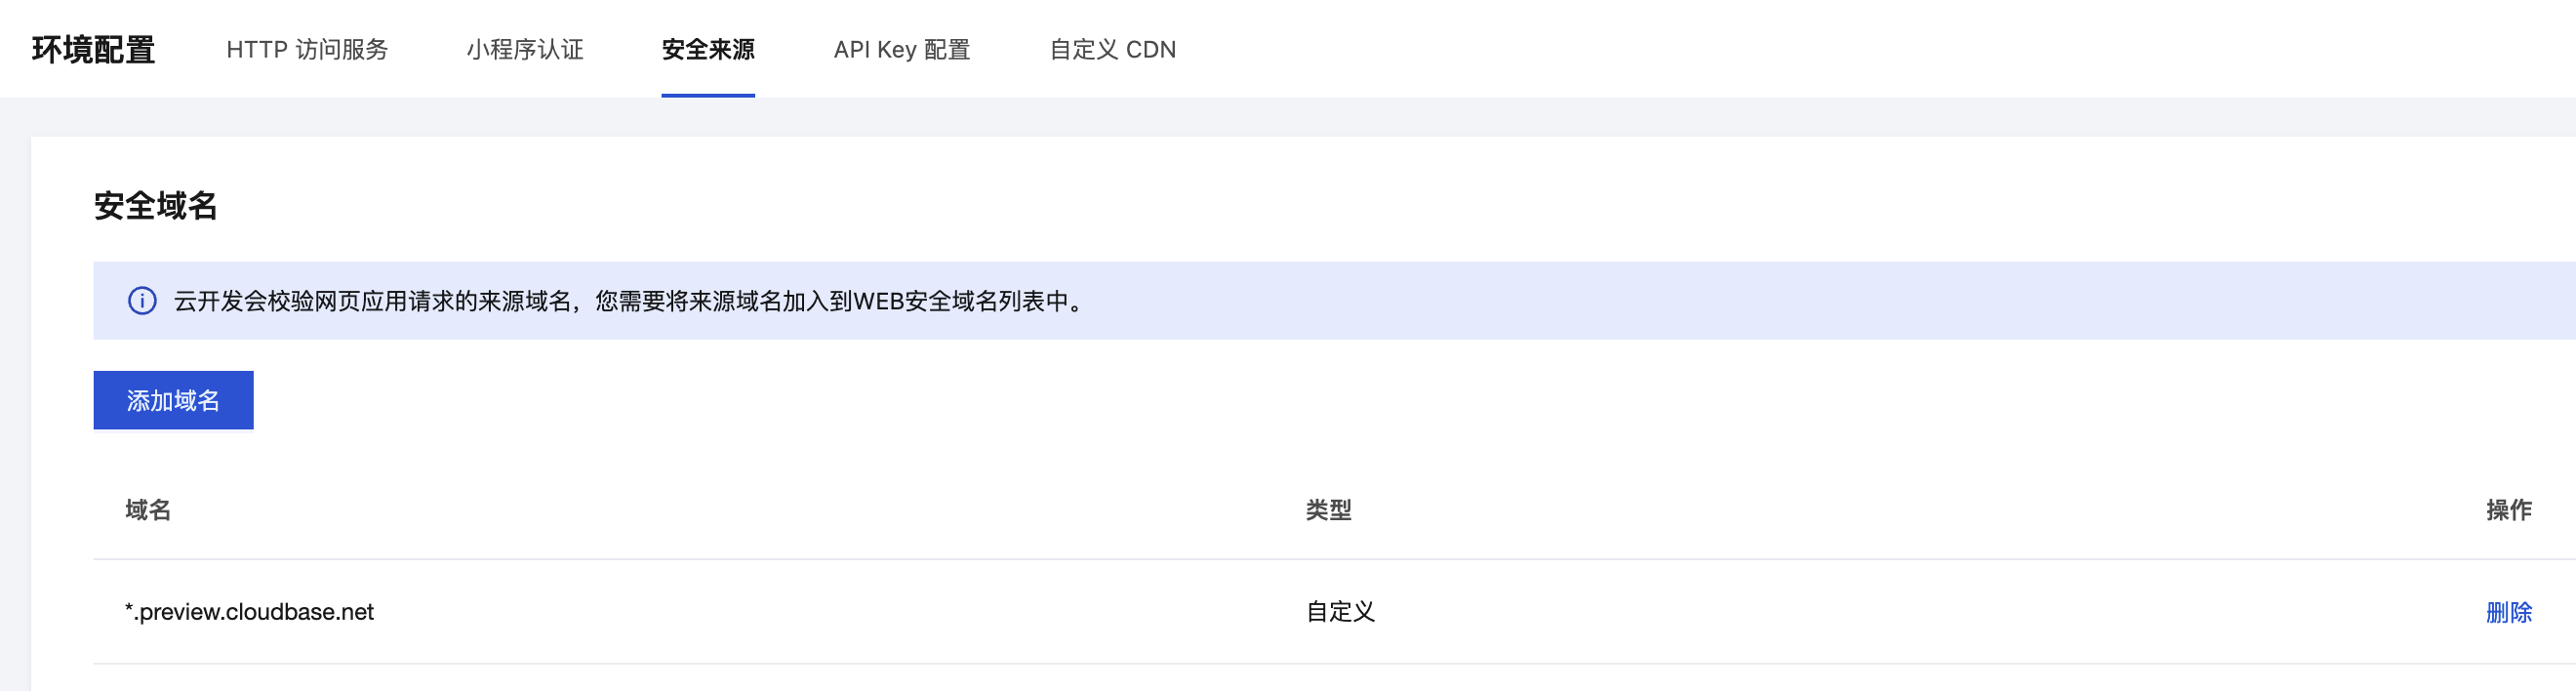
Before web debugging, you need to add docs.cloudbase.net to the web security domains. Refer to Configure Security Domains